1. Foreign direct investments in 2014
This review examines the global development of foreign direct investments and Finland's investment flows, as well as the effect of these investment flows on Finland’s national economy in 2014. The different sections of the review raise factors that affect the interpretation of the figures and the scope of description of the statistics should also be considered when using the figures. The statistics on foreign direct investments mainly depict financial transactions between domestic and foreign units in multinational groups and the assets and liabilities these generate, as well as international corporate acquisitions. The statistics on foreign direct investments do not, in most cases, describe foreign real investments into Finland. If, for example, a domestic company under foreign control makes a factory expansion investment in Finland and does not receive financing for this directly from a foreign investor, nothing of the value of the factory expansion investment is recorded in the statistics on direct investments. More about the definitions of the concepts used in this review can be found in the statistics home page (http://www.stat.fi/til/ssij/kas_en.html).
1.1 Global FDI
According to the investment report published by the United Nations Conference on Trade and Development, flows of global FDI decreased by 16 per cent in 2014, while during the same period, world trade increased by 3.4 per cent and the whole world's GDP by 2.6 per cent (UNCTAD: World Investment Report 2015). The decrease in foreign direct investments was affected by increased economic and political instability. The decline in investment flows was also considerably affected by major enterprise reorganisations where a foreign investor pulled out of the target country. In 2014, a total of 223 large international enterprise reorganisations of over USD one billion were made, which was the most since 2008.
In total, global foreign direct investments amounted to EUR 924 billion, of which EUR 376 billion were directed at developed countries and EUR 513 billion at developing economies. Investments to developed countries decreased by 28 per cent, while investments to developing countries increased by two per cent. For the first time, China became the largest host country of direct investments. Of the investing continues, United States is still the largest ahead of China and Japan.
Figure 1: Global flows of FDI in 2004 to 2014
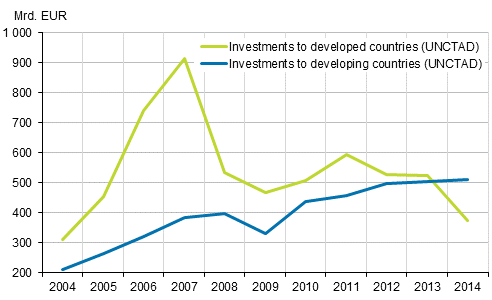
Investments directed at Europe decreased by 11 per cent from the previous year. Direct investments to Russia decreased by 70 per cent. Among other European countries, investments to, for example, Ireland, Belgium, France and Spain decreased, while investments to Great Britain, Switzerland and Finland increased clearly.
The report predicts that investment flows will grow in 2015 to 2017. The growth estimate for 2015 is 11 per cent. The growth trend of future years is based on UNCTAD's own modelling of investment flows and on a survey directed at directors of multinational companies according to which an increasing share of enterprises plan to increase their direct investments in the next few years. The risks for the materialisation of the growth estimate are, for example, an expansion of international conflicts, continuation of the Euro crisis, and a slowdown in the economic growth of some emerging market areas.
Figure 2. Flows of FDI in 2004 to 2014
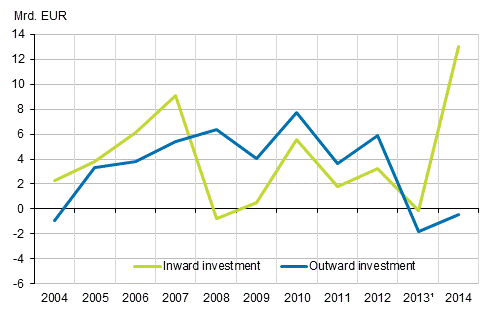
�) Starting from 2013, the figures are not fully comparable with those for 2004 to 2012 due to changes in the international statistical standard.
1.2 Finland's inward FDI
The year 2014 was the third successive year of downturn for Finland's economy. Gross domestic product went down by 0.4 per cent and the unemployment rate rose from 8.2 to 8.7 per cent. The external balance of Finland's national economy also weakened. The current account was still in deficit even though the deficit did contract from EUR 3.4 billion in 2012 to EUR 1.8 billion in 2014. The net international investment position stood at EUR -8.2 billion at the end of 2014, having been EUR 7.1 billion in 2013. The net international investment position has been declining since 2010.
Finland's inward FDI totalled EUR 13.0 billion on net in 2014. The heavy growth in direct investments was especially caused by business acquisitions where significant enterprises owned by Finns were either fully or partially transferred to foreign ownership. Internal financial arrangements by multinational groups also increased Finland's inward FDI.
Foreign direct investments are often interpreted too simply as real investments but this is not often the case according to a study published last year (ETLA, Topias Leino ja Jyrki Ali-Yrkk�: How does foreign direct investment measure real investment by foreign owned companies) . Flow-through investments and enterprises' ownership changes do not often lead to real investments in the host country of the investment. On the other hand, if international enterprises operating in the country use domestic financing channels to finance their investments, this is not visible as a foreign direct investment. The heavy concentration of business activities also creates interpretation problems. Several small investments made into growth enterprises disappear into the normal intra-group financing solutions of multinational enterprises. Despite the interpretation problems of the statistics, Finland's attractiveness as an investment object does not seem to be weakening. This interpretation is also supported by Finpro's statistics, according to which 229 new internationally owned enterprises came to Finland in 2014 while the corresponding figure in 2013 was 213.
At the end of 2014, the value of FDIs was EUR 77.3 billion, of which equity accounted for EUR 62.0 billion and the value of debt capital for EUR 15.3 billion. During 2014, the value of FDIs grew by EUR 13.0 billion. The growth in the investment portfolio is clearly visible in both equity and debt-based items and is mainly caused by the net investment flow (see Table 1).
Table 1. Finland's inward FDI
| Total | Equity | Debt | |
| Stock of investments 31 Dec 2013 | 64.4 | 56.1 | 8.3 |
| Financial transactions | 14.7 | 6.1 | 8.6 |
| Re-invested earnings | -1.6 | -1.6 | 0.0 |
| Changes in the exchange rates | -0.1 | 0.0 | -0.1 |
| Other valuation adjustments | -0.1 | 1.4 | -1.5 |
| Stock of investments 31 Dec 2014 | 77.3 | 62.0 | 15.3 |
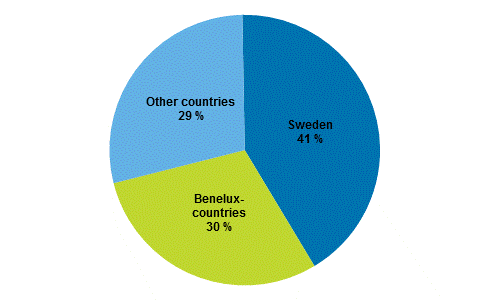
Examined by country, direct investments have been made to Finland particularly from Sweden (41% of the investment stock), the Netherlands (18%), Luxembourg (11%) and Denmark (7%). Examined by country group, investments to Finland mainly come from the EU area, whose combined share of the investment stock was 92 per cent in 2014. In 2014, the share of eurozone countries grew from 31 to 38 per cent, which was mainly caused by a heavy growth in investments from Luxembourg and the Netherlands. The shares presented here were calculated by the immediate investor country. In fact, investments are often managed through an affiliate abroad, in which case the ultimate controlling investor is located in another country. These figures calculated by the ultimate investor are examined in more detail in Section 1.5 of this review.
Figure 3. Direct investments into Finland by the immediate investor country on 31 December 2014
Examined by industry, inward FDI is particularly directed to financing activities and metal industry enterprises. The industry of the investment is determined based on the industry of the domestic unit. Then, the share of financing activities is increased by arrangements where a Finnish manufacturing enterprise, for example, is managed from abroad through a domestic holding company established for that purpose.
Finland's inward FDI generated returns of EUR 4.6 billion in total for foreign investors in 2014. Dividends paid for these investments amounted to EUR 5.6 billion and interests to EUR 0.6 billion, that is, in total clearly more than what investments produced in 2014. The difference was EUR 1.6 billion, which is recorded as a negative item in reinvested earnings paid from Finland to abroad and correspondingly, it reduces the inward FDI flow. Reinvested earnings describe the difference between the returns accrued and paid to owners in a given year. Negative reinvested earnings are produced in a situation where the return assets generated in earlier years are distributed to owners in one year.
Income paid to foreign investors relative to the value of investments remained almost on level with the previous year. In 2014, returns relative to the value of investments at the end of the year were 5.9 per cent, while in 2010 to 2013, the rate of return was 6.6 per cent, on average.
1.3 Finland's outward FDI
In 2014, outward FDI totalled EUR -0.4 billion on net. Thus, a little less capital flowed outward than was repatriated. Foreign equity investments totalled EUR 1.3 billion on net but a decrease in debt assets by EUR 1.8 billion pushed the net flow of investment into negative in 2014. Most outward capital flow was direct investments to the Netherlands (EUR +2.5 billion) and Switzerland (EUR +2.4 billion). Most capital invested in direct investments was, in turn, repatriated from the United States (EUR -2.0 billion) and Belgium (EUR -1.5 billion).
Table 2. Finland's outward FDI
| Total | Equity | Debt | |
| Stock of investments 31 Dec 2013 | 105,4 | 99,4 | 5,9 |
| Financial transactions | -0,4 | 1,3 | -1,8 |
| Re-invested earnings | 0,0 | 0,0 | 0,0 |
| Changes in the exchange rates | -1,7 | -1,2 | -0,5 |
| Other valuation adjustments | -6,7 | -5,9 | -0,6 |
| Stock of investments 31 Dec 2014 | 96,6 | 93,6 | 3,0 |
At the end of 2014, the value of outward FDI was EUR 96.6 billion, of which equity accounted for EUR 93.6 billion and the value of debt capital for EUR 3.0 billion. The value of the investment portfolio of direct investments decreased by EUR 8.8 billion during 2014. The drop in value was explained more by changes in exchange rates and other valuation changes and not actual investment activities. The value change of objects owned abroad, which is based on changes in the market value of listed companies and the book value of unlisted targets, are recorded in other valuation changes (EUR -6.7 billion). Other valuation changes also include classification changes that are caused by a change in the investment type. For example, if the voting power entitling to ownership in a foreign investment object falls below ten per cent, the investment no longer fulfils the criteria of a direct investment and it is classified either as a portfolio investment or other investment.
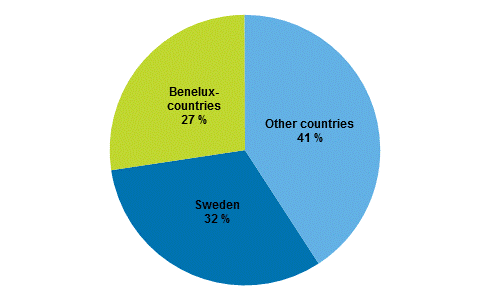
Examined by country, FDI is especially directed to Sweden (32% of the investment stock) and the Netherlands (19%). Examined by country group, investments from Finland are mainly directed to the EU area, whose combined share of the investment stock was 82 per cent at the end of 2014. The share of the countries belonging to the currency union was 45 per cent at the end of 2014. Significant direct investments outside the EU are found in the United States (EUR 6.2 billion), Switzerland (EUR 3.7 billion) and Russia (EUR 2.2 billion). The value of Russian investments decreased by EUR 0.6 billion from the year before.
The shares above were calculated according to the country of the immediate investment target, in which case the appeal of the Asian rising economies is small. For example, the value of investments to China was EUR 0.2 billion and to India EUR 0.1 billion at the end of 2014, while according to the statistics on Finnish affiliates abroad, there were 694 affiliates of Finnish enterprises in Asia and Oceania and their share of the turnover generated abroad was 15 per cent. There are no data available on outward FDI according to the country of the ultimate investment target, so it is not possible to give a more exact specification of the final investment target. Most of the investments to the Benelux countries are connected to the management of a global enterprise or its part and the actual production activity is located in some other country - elsewhere in Europe or Asia.
Figure 4. Finland's outward FDI by immediate host country on 31 December 2014
Examined by industry, enterprises having made foreign direct investments mainly represent the metal industry and service industries. At the end of 2014, the value of investments by metal industry enterprises was in total EUR 26,1 billion, of which EUR 7.5 billion was directed to the Netherlands, EUR 4.4 billion to the United States and EUR 4.2 billion to Sweden. In turn, the value of service enterprises' investments was EUR 31.3 billion at the end of 2014. These investments were centred strongly in Sweden (EUR 16.6 billion) and the Netherlands (EUR 8.5 billion).
Outward FDI generated returns of EUR 8.3 billion in total for Finland in 2014, which was EUR 2.3 billion more than in 2013. Dividends from these investments amounted to EUR 7.8 billion and interests to EUR 0.5 billion. As a result of increased income and a smaller investment portfolio, returns gained by Finland relative to the value of FDI grew clearly from the previous year. In 2014, the rate of return was 8.5 per cent, having been 5.6 per cent in 2013.
1.4 Direct investments in the balance of payments
At the end of 2014, the value of Finland's inward FDI was EUR 77.3 billion and that of outward FDI was EUR 96.6 billion. Thus, Finland still has more assets than liabilities from direct investments even though, as a result of a decline in assets and increase in liabilities in 2014, international direct investment assets on net halved to EUR 19.3 billion from EUR 41.0 billion in 2013. Direct investments improve, in particular, the net international investment position of the business sector, which stood at EUR 26.1 billion at the end of 2014. The liabilities of financial and insurance corporations related to direct investments exceeded, in turn, the assets by EUR 7.8 billion. Net international position connected to direct investments is the same in the statistics on balance of payments and international investment position, although the gross figures of balance of payments differ from the figures presented here according to the directional principle (The differing statistical method of balance of payments is discussed more in Section 2.2 of the review for the statistical reference year 2013).
Figure 5. Foreign direct investments in 2004 to 2014
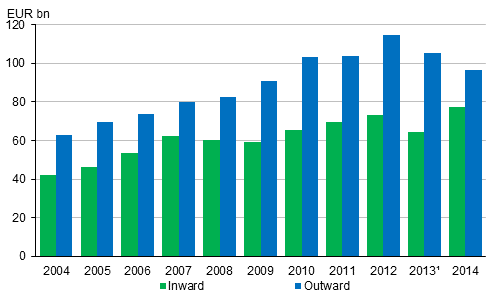
�) Starting from 2013, the figures are not fully comparable with those for 2004 to 2012 due to changes in the international statistical standard.
In 2014, returns on inward FDI amounted in total to EUR 8.3 billion and on outward FDI to EUR 4.6 billion. This property income is recorded in the primary income item of Finland's current account and its net effect on Finland's current account was EUR +3.7 billion in 2014. From the viewpoint of Finland's current account, returns on direct investments were also the only type of investment in surplus. The net effect of returns from portfolio investment on the current account was EUR -2.1 billion and that of other investments EUR -1.3 billion.
Figure 6 also shows that returns connected to direct investments have improved Finland's current account throughout the reference period 2004 to 2014. Annual returns gained by Finland have varied between EUR 5.2 and 8.5 billion and these investments have yearly produced a surplus of EUR 1.2 to 4.3 billion.
Figure 6. Returns on FDI in 2004 to 2014
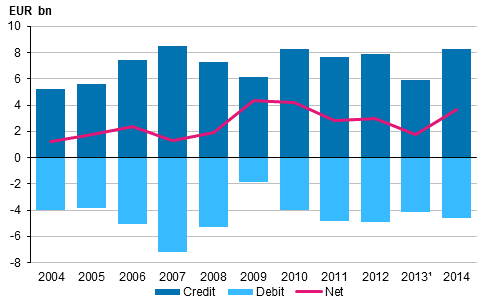
�) Starting from 2013, the figures are not fully comparable with those for 2004 to 2012 due to changes in the international statistical standard.
1.5 Investments according to the ultimate investing country
FDI statistics have traditionally been compiled only on the basis of the immediate investor country. The new statistical standards and data collected on a more detailed level than before enable country-specific analyses of direct investments also by the ultimate investing country starting from 2013. The ultimate direct investor here refers to the one that is topmost in the ownership chain of the foreign direct investor. The ultimate direct investor is not controlled by any other unit and it can also be a domestic unit.
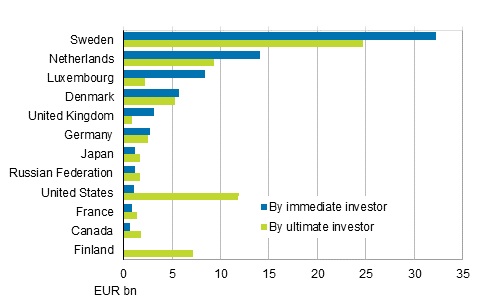
Figure 7 shows that direct investments to Finland have been made clearly more from Sweden, the Netherlands and Luxembourg if investments are viewed according to the immediate investor country. This indicates that these investments are managed through an enterprise located in these countries, although the actual investor is elsewhere. The case is opposite for the United States. In 2014, the FDI stock to Finland from the United States was ten times larger when viewed on the basis of the ultimate investing country (EUR 11.9 billion) than on the basis of the immediate investor country (EUR 1.1 billion). This means that a clearly larger share of FDI into Finland is managed in the USA than made immediately into Finland. Investments from Canada, Japan, France and Russia are also larger if they are viewed on the basis of the ultimate investing country. Examined by the ultimate direct investor, the share of Finland is also significant. This is caused by domestic enterprises recycling capital through their affiliates abroad back to Finland.
Figure 7. Foreign direct investments to Finland in 2014, investment stock
1.6 Finland's outward FDI by ultimate investing country
It is not possible to compile statistics on Finland's outward FDI by ultimate host country with the help of available data sources. However, by researching the ownership chain of enterprises that have made foreign investments from Finland we can examine what proportion of Finland's outward FDI has been made by enterprises that are under Finnish control. The limitation of such an examination is that it only covers the ownership chain of units in corporate form. For example, the true owners of a parent company registered in Luxembourg can be Finnish private citizens.
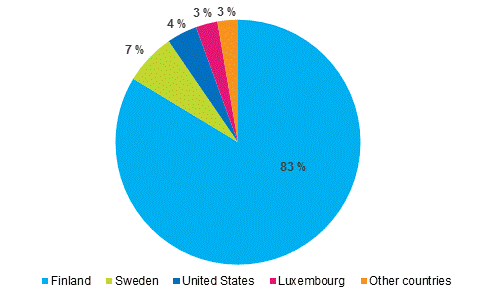
In 2014, the value of Finland's outward FDI was EUR 96,6 billion, of which 83 per cent were held by enterprises under Finnish control. The most considerable ultimate investing countries outside Finland were Sweden, the United States and Luxembourg (see Figure 8).
Figure 8. Finland's outward FDI by ultimate investing country in 2014
Source: Foreign direct investments 2014, Statistics Finland
Inquiries: Kristian Taskinen 029 551 2238, balanceofpayments@stat.fi
Director in charge: Ville Vertanen
Updated 30.10.2015
Official Statistics of Finland (OSF):
Foreign direct investments [e-publication].
ISSN=2342-351X. 2014,
1. Foreign direct investments in 2014
. Helsinki: Statistics Finland [referred: 6.2.2026].
Access method: http://stat.fi/til/ssij/2014/ssij_2014_2015-10-30_kat_001_en.html

