Published: 4 December 2018
Birth rate has decreased in all educational groups
According to Statistics Finland, the total fertility rate has decreased in all women's educational groups after 2010, when the present decrease in the birth rate started. The fertility rate of women with basic level education has gone down by 25 per cent and that of those with tertiary level education by 24 per cent from 2010. The fertility rate has diminished slightly less among those with upper secondary level education, by 20 per cent.
Total fertility rate of women born in Finland by level of education in 2006 to 2017
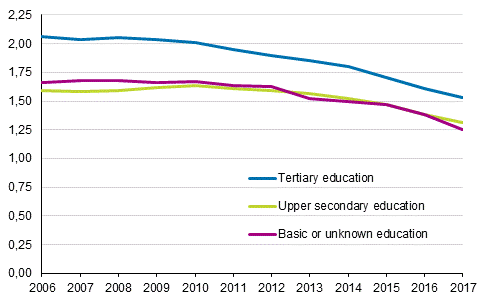
The total fertility rate is commonly used in measuring fertility. It indicates how many children a woman would give birth to calculatorily during her life time if fertility rates remained the same as in the year on which the calculation is based.
The data concern here only mothers and fathers born in Finland. A share of qualifications taken abroad are missing from Statistics Finland's Register of Completed Education and Degrees, for which reason the qualification data of many persons born abroad are deficient.
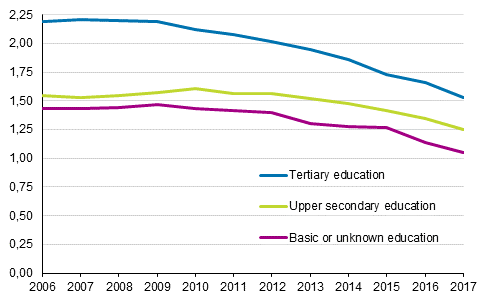
The fall in the total fertility rate has been similar for men to that for women. However, the change from 2010 has been steeper in all men’s educational groups.
Total fertility rate of men born in Finland by level of education in 2006 to 2017 ¹)
1) Information on fathers of children born outside marriage is obtained only when paternity is confirmed, and that is why it is received at a delay. For this reason, there may be slight deficiencies in the data for 2017 concerning fathers. For around one per cent of children, information on fathers is completely missing.
For men with tertiary level education, the total fertility rate has decreased by 28 per cent and for those with basic level education by 27 per cent since 2010. The fertility rate has diminished slightly less among those with upper secondary level education, by 22 per cent.
For men the mutual differences of educational groups in the levels of fertility are bigger than for women: for men the fertility rate of those with basic level education is clearly lower than in other groups. The total fertility rate of men with tertiary level education has been slightly higher than among women of the same educational group, but now they are at the same level.
Share of childless persons has grown among women aged 35 to 39 with basic level education
Next we examine the share of childless women aged 25 to 29 and 35 to 39 born in Finland by level of education. Not all persons aged 25 to 29 have necessarily completed their highest qualification yet and their number of children is not final either, but changes in the birth rate at that age reflect part of the general fall in the birth rate.
For those aged 35 to 39, the number of children is not necessarily final, but the growth in the share of childless women in this age group is connected to the fall in the birth rate.
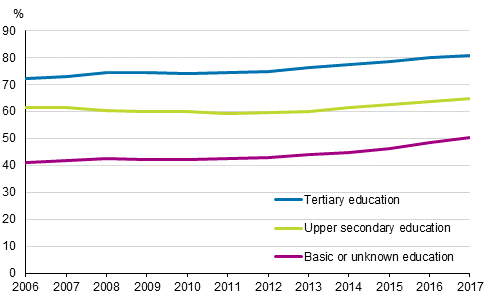
The share of childless persons aged 25 to 29 is highest for those with tertiary level education and lowest for those with basic level education, when examining women born in Finland. The share of childless persons has risen in all educational groups of those aged 25 to 29 between 2010 and 2017.
The share of childless persons has risen most among those with basic level education, by 8.2 percentage points between 2010 and 2017. The share of childless people has risen by 6.8 percentage points among those with tertiary level qualifications and by five percentage points among those with upper secondary level education.
Share of childless women aged 25 to 29 by level of education in 2006 to 2017, born in Finland, per cent
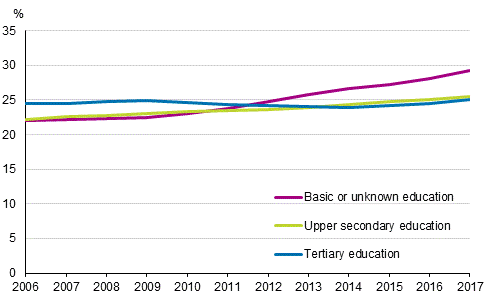
In the ten years older age group, those aged 35 to 39, the shares of childless persons according to educational groups has turned the other way in recent years – those with tertiary level education no longer have the biggest share of childless persons. Starting from 2012, the share of childless persons has been highest for women with basic level education, and the share has grown ever since.
The share of childless women among those with tertiary level education has not changed much in the period 2006 to 2017. It has risen slightly among those with upper secondary education.
Share of childless women aged 35 to 39 by level of education in 2006 to 2017, born in Finland, per cent
Birth rate has diminished by one fifth
The birth rate in general has declined considerably from 2010 to 2017. Measured by the total fertility rate, it diminished in seven years by 20 per cent, from 1.87 children per woman to 1.49 children per woman. The total fertility rate can be broken down by the order number of the child born.
Total fertility rate broken down by birth order of child 1990–2017
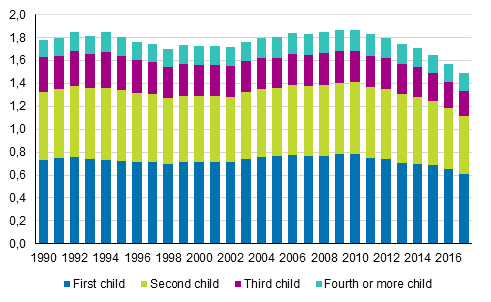
The decrease in total fertility was broken down by the number of children so that the change grew the lower the order number of the child was. For the first child, the change from 0.78 to 0.61 children per women from 2010 to 2017 means a reduction of 22 per cent. Correspondingly, the change percentage for fertility for the fourth and higher order number children was 16.
Few first-born were born
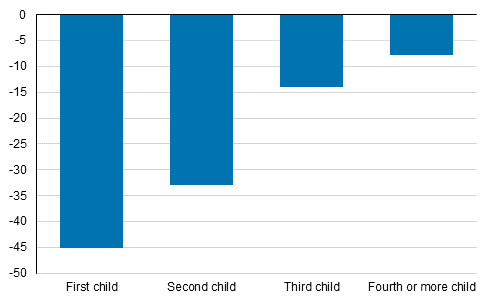
From the breakdown of the total fertility rate by the birth order of child it is clearly visible that the change has taken place for the first child when comparing 2010 and 2017. The total fertility rate diminished from 1.87 to 1.49 between 2010 and 2017, that is, the change was 0.38 children. Of this change, the share of first-born children was 45 per cent. The share of the second child was also big in the change, 33 per cent.
Change in total fertility rate broken down by birth order of child in 2010 to 2017, per cent
Large differences between regions in the birth rate and its decrease
In 2010, the total fertility rate was lowest in Uusimaa, 1.70 children per woman and highest in North Ostrobothnia, 2.40 children per woman. The difference between the highest and lowest figures was 0.70.
In 2017, the total fertility rate was still lowest in Uusimaa, 1.38 children per woman, but highest in Central Ostrobothnia, 1.96 children per woman. In 2017, the differences between regions in the birth rate had narrowed down slightly compared with 2010, as the difference between the highest and lowest figures was a little smaller, 0.57 children per woman.
Size of the change in the birth rate varies considerably by region
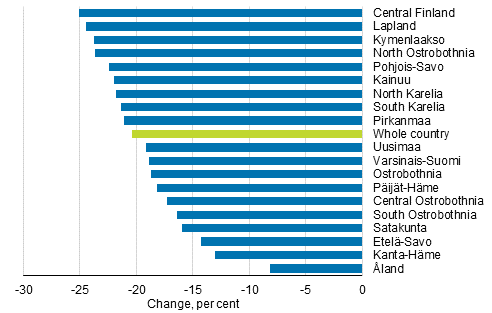
The change in the birth rate has been relatively biggest in Central Finland, where the total fertility rate was 25 per cent lower in 2017 than in 2010. Correspondingly, the change in Mainland Finland regions was smallest in Kanta-Häme, where the total fertility rate diminished by 13 per cent. However, the relative change was smallest in Åland, where the birth rate declined by just eight per cent in seven years.
Change of total fertility rate by region from 2010 to 2017, per cent
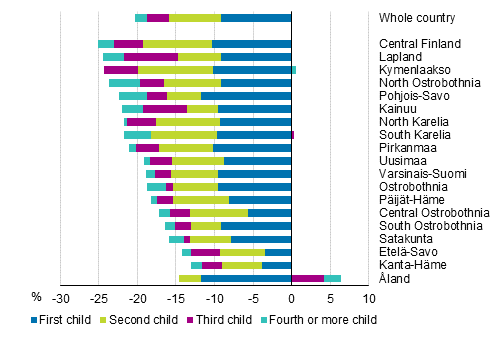
When the change in the total fertility rate of a region is broken down by the order number of the child, it can be seen that in almost all regions, the biggest change has happened for the first child compared 2010 to 2017. However, only in five regions the share of first-born children in the decreasing birth rate is over 50 per cent. This means that in all other regions, the share of the second, third child, etc. in the decreasing birth rate is over one half.
Change in total fertility rate in 2010 to 2017 broken down by birth order by region, per cent
Big changes in the age of becoming a mother in Europe
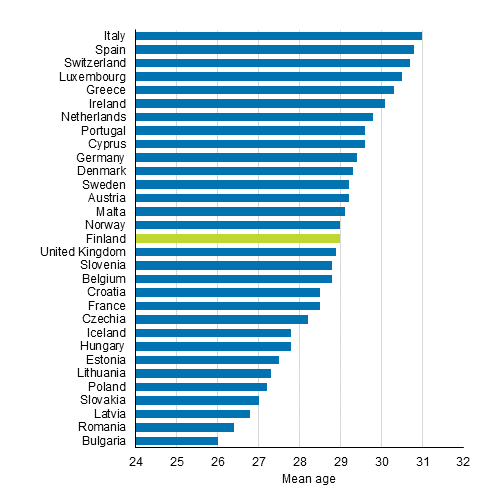
Becoming a mother for the first time has also been postponed in Finland. However, women in Finland become mothers nowhere near as old as in many other European countries. Finland is placed in the middle in the comparison of the average age of first-time mothers in the EU. In the Nordic comparison, only in Iceland first-time mothers women are younger than in Finland.
The average age of first-time mothers is oldest in Italy, 31 years. The youngest women give birth to their first child in Bulgaria, at the age of 26, on average. The birth rate was lowest in Italy together with Spain in 2016. The high and low average age of first-time mothers does not, however, go hand in hand with the birth rate, because of the European Union countries, Sweden had the second highest birth rate in the reference year.
Woman’s age at first live birth in some European countries in 2016
Source: Eurostat
Share of mothers with Finnish background in the birth rate decreases further
Fertility can also be examined from the point of the mother's origin. The share of people with Finnish background in the total fertility rate has gradually fallen, and that of persons with foreign background has correspondingly grown.
The share of persons with foreign background in the birth rate of the whole country has increased slowly from the 1990s and is currently around 13 per cent of the whole country’s birth rate. In the corresponding time, the share of women with foreign background in all women aged 15 to 49 has grown slightly slower, however, to 9.8 per cent.
Total fertility rate broken down by mother's origin in 1990 to 2017
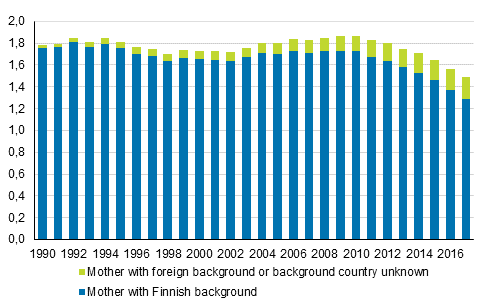
According to the whole country’s birth rate in 2017, women's average number of children would be 1.49 children per woman. When this is broken down by origin, the share of women with Finnish background of this is 1.29 children per woman and that of women with foreign background 0.20 children per woman.
When examining the fall in the birth rate that started from 2010, it can be seen that only the share of women with Finnish background in the birth rate has fallen. The share of persons with Finnish background in the birth rate has gone down by 25 per cent in the past seven years. In contrast, the share of persons with foreign background in the birth rate has grown by 36 per cent over this period.
Further information about the birth rate according to origin is available on Statistics Finland's Immigrants and integration thematic pages in the section Birth rate .
Source: Births 2017. Statistics Finland
Inquiries: Marja-Liisa Helminen 029 551 3273, Timo Nikander 029 551 3250, info@stat.fi
Director in charge: Jari Tarkoma
Publication in pdf-format (331.3 kB)
- Tables
-
Tables in databases
Pick the data you need into tables, view the data as graphs, or download the data for your use.
Appendix tables
- Figures
- Quality descriptions
-
- Quality description, births 2017 (4.12.2018)
Updated 04.12.2018
Official Statistics of Finland (OSF):
Births [e-publication].
ISSN=1798-2413. 02 2017. Helsinki: Statistics Finland [referred: 22.2.2026].
Access method: http://stat.fi/til/synt/2017/02/synt_2017_02_2018-12-04_tie_001_en.html

