

Published: 26 February 2021
Producer prices for manufactured products fell by 0.8 per cent from January last year
Corrected 26 February 2021: Appendix table was 25 corrected. The correction is indicated in red.
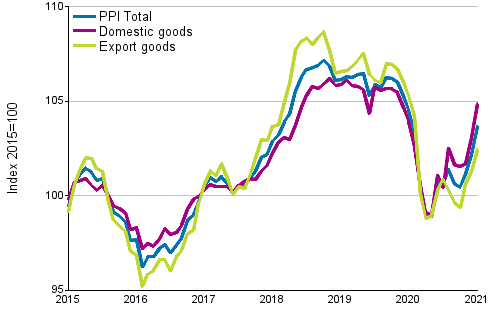
According to Statistics Finland, producer prices for manufactured products fell by an average of 0.8 per cent from January 2020 to January 2021. The producer prices for manufactured products sold on the domestic market increased by 0.9 per cent, while the producer prices of export products fell by 2.7 per cent.
Producer Price Index (PPI) 2015=100, 1/2015–01/2021
The drop in the producer prices for manufactured products was particularly attributable to fallen prices of oil products, pulp, paper, paperboard and cardboard, as well as electronic appliances from January of the previous year.
The export price index fell by 2.6 per cent and the import price index by 3.3 per cent over the year. The basic price index for domestic supply went down by 0.6 per cent. The basic price index for domestic supply including taxes remained on average unchanged.
The drop in the export price index was particularly attributable to fallen prices of oil products, pulp, paper, paperboard and cardboard, as well as electronic appliances from January of the previous year. The fall in the import price index was, in turn, especially caused by lower prices of crude oil and oil products.
From December to January, producer prices for manufactured products rose by 1.4 per cent. Producer prices were particularly boosted by the risen prices of oil products compared with the previous month.
Producer Price Indices 2015=100, January 2021
| Index | Monthly change, % | Annual change, % | |
| Producer Price Index, total | 103.7 | 1.4 | -0.8 |
| - Producer Price Index, domestic goods | 104.9 | 1.7 | 0.9 |
| - Producer Price Index, export goods | 102.4 | 1.1 | -2.7 |
| Export Price Index | 102.2 | 1.1 | -2.6 |
| Import Price Index | 104.3 | 2.0 | -3.3 |
| Basic Price Index for Domestic Supply | 106.2 | 1.4 | -0.6 |
| Basic Price Index for Domestic Supply, incl. taxes | 106.7 | 1.3 | 0.0 |
Producer Price Indices 1949=100, January 2021
| Index | Monthly change, % | Annual change, % | |
| Production Price Index | 1995 | 1.4 | -0.8 |
| Export Price Index | 1697 | 1.1 | -2.5 |
| Import Price Index | 1600 | 2.0 | -3.3 |
| Wholesale Price Index | 2362 | 1.3 | 0.0 |
Weight structures of producer price indices updated
Producer price indices are annual chain indices, i.e. the weight structure of the indices is updated annually in January. The latest available data from National Accounts, the statistics on industrial output and Finnish Customs’ statistics on foreign trade are used when preparing the weight structures. The latest data from the supply and use tables of the National Accounts concerned the year 2017. In respect of domestic supply, imports and exports these were raised by using the 2-digit level data for 2019 that were available from National Accounts. The most detailed level product group and enterprise weights are based on data from the foreign trade statistics of Finnish Customs and statistics on industrial output for 2019. In addition to the weight structure, product categories and the enterprise sample have also been updated.
Updating of the weight structure and sample improves the quality of the indices, because with their help, structural changes in production, exports and imports can be taken into account faster.
Calculation of the consumer price of wood pellets was revised
The calculation of the consumer price of wood pellets and the index based on the consumer price has been revised and the base year of the index has been changed to 2015=100. The sample and weight structure of consumer sales points in the index have been updated to correspond with the value data on consumer sales for 2018. The index data and the average price of wood pellets have been calculated with the new sample and weights starting from February 2020. November 2019 and data prior to this are based on the old sample and weights. The index is scaled so that the average for 2015 is 100. If necessary, the new point figures for the 2015=100 series can be scaled to point figures for the 2010=100 series by multiplying them with the chaining coefficient 1.05031.
Source: Producer Price Index 2021, January. Statistics Finland
Inquiries: Anna-Riikka Pitkänen 029 551 3466, Ville Auno 029 551 3023, thi.tilastokeskus@stat.fi
Head of Department in charge: Katri Kaaja
Publication in pdf-format (397.9 kB)
- Tables
-
Tables in databases
Pick the data you need into tables, view the data as graphs, or download the data for your use.
Appendix tables
- Appendix table 1. Producer Price Indices 2015=100, index numbers and year-on-year changes, January 2021 (26.2.2021)
- Appendix table 2. Producer Price Indices 1949=100, January 2021 (26.2.2021)
- Appendix table 3. Producer Price Index 2015=100 (CPA 2015), January 2021 (26.2.2021)
- Appendix table 4. Producer Price Index 2015=100 (MIG), January 2021 (26.2.2021)
- Appendix table 5. Export Price Index 2015=100 (CPA 2015), January 2021 (26.2.2021)
- Appendix table 6. Export Price Index 2015=100 (MIG), January 2021 (26.2.2021)
- Appendix table 7. Import Price Index 2015=100 (CPA 2015), January 2021 (26.2.2021)
- Appendix table 8. Import Price Index 2015=100 (MIG), January 2021 (26.2.2021)
- Appendix table 9. Basic Price Index for Domestic Supply 2015=100 (CPA 2015), January 2021 (26.2.2021)
- Appendix table 10. Basic Price Index for Domestic Supply 2015=100 (MIG), January 2021 (26.2.2021)
- Appendix table 11. Basic Price Index for Domestic Supply 2015=100 (CPA 2015), including taxes, January 2021 (26.2.2021)
- Appendix table 12. Basic Price Index for Domestic Supply 2015=100 (MIG), including taxes, January 2021 (26.2.2021)
- Appendix table 13. Production Price Index 1949=100 (SITC), January 2021 (26.2.2021)
- Appendix table 14. Production Price Index 1949=100 (ISIC), January 2021 (26.2.2021)
- Appendix table 15. Export Price Index 1949=100, January 2021 (26.2.2021)
- Appendix table 16. Import Price Index 1949=100, January 2021 (26.2.2021)
- Appendix table 17. Wholesale Price Index 1949=100, January 2021 (26.2.2021)
- Appendix table 18. Producer Price Index 2010=100, January 2021 (26.2.2021)
- Appendix table 19. Export Price Index 2010=100, January 2021 (26.2.2021)
- Appendix table 20. Import Price Index 2010=100, January 2021 (26.2.2021)
- Appendix table 21. Basic Price Index for Domestic Supply 2010=100, January 2021 (26.2.2021)
- Appendix table 22. Basic Price Index for Domestic Supply 2010=100, including taxes, January 2021 (26.2.2021)
- Appendix table 23. Producer Price Indices for Services 2015=100, BtoAll, 4th quarter 2020 (26.2.2021)
- Appendix table 24. Producer Price Index, international comparison (26.2.2021)
- Appendix table 25. Wood pellet, consumer price (Appendix table was corrected on 26.2.2021.) (26.2.2021)
- Appendix table 26. Basic Price Index for Domestic Supply 2000=100 (NACE-TOL 2002), January 2021 (26.2.2021)
- Quality descriptions
Updated 26.02.2021
Official Statistics of Finland (OSF):
Producer price indices [e-publication].
ISSN=1799-3695. January 2021. Helsinki: Statistics Finland [referred: 18.7.2026].
Access method: http://stat.fi/til/thi/2021/01/thi_2021_01_2021-02-26_tie_001_en.html