1. Research and development 2016
1.1. R&D personnel decreased by five per cent
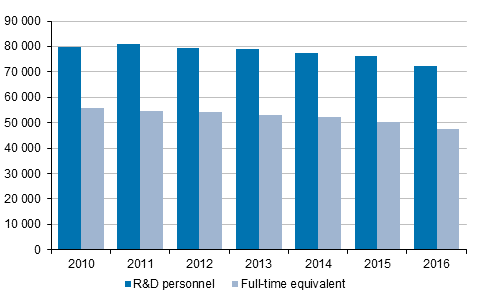
In 2016, altogether 72,400 persons were employed in research and product development tasks, good one-half of them in business enterprises. The number of R&D personnel decreased by 3,700 from the year before, or by five per cent. In business enterprises, the decrease was nearly 2,500 R&D personnel. In both the government sector 1) and the higher education sector the fall was 600 persons. Women made up one-third of research personnel. The share varies by sector, as in business enterprises only one researcher in five was a woman, in the government sector the share of women was 46 per cent and in the higher education sector nearly one half. Seventy-four per cent of the R&D personnel were researchers and R&D engineers, while the rest were engaged in expert or support tasks related to R&D activity.
R&D in full-time equivalents amounted to 47,400 in 2016. The number decreased in all by 2,900, or by six per cent from the year before. The decrease was two per cent in the higher education sector, nine per cent in the government sector and seven per cent in business enterprises. Fifty-eight per cent of R&D in full-time equivalents were made in business enterprises.
Figure 1. R&D personnel and R&D in full-time equivalents in 2010 to 2016
1.2. Decline in R&D expenditure continued but Finland is still an R&D intensive country
The total sum of research and product development expenditure was EUR 5.9 billion in 2016, which is EUR 145 million down on the year before. The fall in total expenditure can be explained by the development of the business enterprises sector. The higher education sector increased by EUR nine million, while R&D expenditure in the government and PNP sector fell by EUR nine million. Research and development expenditure is estimated 2) to grow in 2017 by around EUR 100 million to slightly over EUR six billion. Growth is anticipated mainly for business enterprises. The GDP share is estimated to be 2.7 per cent.
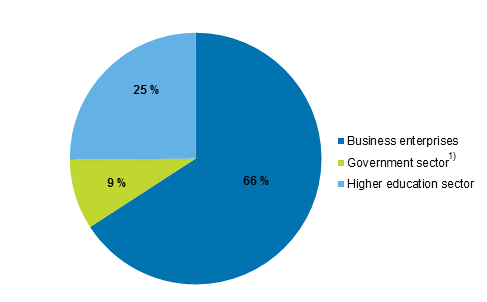
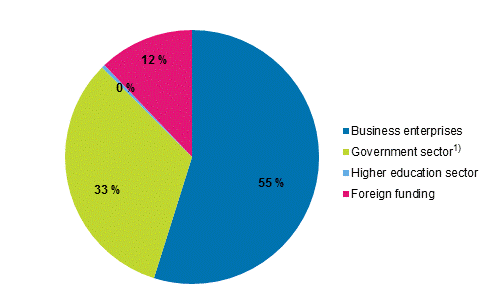
Business enterprises account for 66 per cent of R&D expenditure and for 55 per cent of funding of expenditure 3) in 2016. The government sector is responsible for nine per cent of expenditure, but in funding its share is 33 per cent (including basic funding of the higher education sector by the Ministry of Education and Culture). The significance of the higher university sector as a provider of funds is under half a per cent.
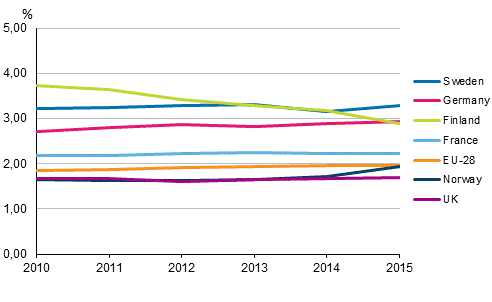
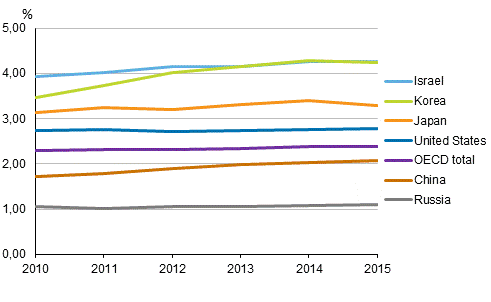
The GDP share of research and development expenditure was 2.8 per cent in 2016. At its highest, the share was 3.75 per cent in 2009. Although the share has dropped in recent years, it is still higher in Finland than average for OECD and EU countries. Based on the data for 2015, Israel (4.2%), South Korea (4.2%), Switzerland (3.4%) and Japan (3.3%) are clearly ahead of Finland. With its GDP share of 3.2 per cent, Sweden was even with Finland in 2014, but in 2015 Finland’s share dropped to 2.9 per cent while Sweden retained its previous level. Austria, Taiwan, Denmark and Germany are now higher on the list than Finland. Of the European Union’s gross domestic product, 1.96 per cent was spent on research and development in 2015. The corresponding share for the OECD area was 2.38 per cent 4) . International figures can be found via the statistics’ links page .
Table 1. Research and development expenditure by sector and share of gross domestic product in 2008 to 2016 and an estimate for the year 2017
| Year | Sector | Total | Share of R&D in GDP 2) | ||||||
| Business enterprise sector | Government sector 1) | Higher education sector | |||||||
| EUR mil. | % | EUR mil. | % | EUR mil. | % | EUR mil. | % | % | |
| 2008 | 5 102,0 | 74,3 | 588,5 | 8,6 | 1 180,6 | 17,2 | 6 871,1 | 100 | 3,55 |
| 2009 | 4 847,2 | 71,4 | 656,5 | 9,7 | 1 282,8 | 18,9 | 6 786,5 | 100 | 3,75 |
| 2010 | 4 854,5 | 69,6 | 692,0 | 9,9 | 1 424,8 | 20,4 | 6 971,3 | 100 | 3,73 |
| 2011 | 5 047,4 | 70,5 | 684,4 | 9,6 | 1 431,8 | 20,0 | 7 163,7 | 100 | 3,64 |
| 2012 | 4 695,0 | 68,7 | 662,2 | 9,7 | 1 474,6 | 21,6 | 6 831,9 | 100 | 3,42 |
| 2013 | 4 602,4 | 68,9 | 643,6 | 9,6 | 1 438,1 | 21,5 | 6 684,2 | 100 | 3,29 |
| 2014 | 4 409,5 | 67,7 | 613,1 | 9,4 | 1 489,5 | 22,9 | 6 512,1 | 100 | 3,17 |
| 2015 | 4 047,3 | 66,7 | 543,1 | 8,9 | 1 480,5 | 24,4 | 6 070,9 | 100 | 2,90 |
| 2016 | 3 901,7 | 65,8 | 534,6 | 9,0 | 1 489,8 | 25,1 | 5 926,1 | 100 | 2,75 |
| 2017 3) | 3 993,2 | 66,1 | 554,2 | 9,2 | 1 495,3 | 24,7 | 6 042,7 | 100 | 2,72 |
2) GDP 2015 and 2016 Statistics Finland preliminary figures, GDP 2016 forecast of Ministry of Finance.
3) Estimate based on survey responses and other calculations
Figure 2a. R&D expenditure by performing sector in 2016
1) Incl. private non-profit sector
Figure 2b. R&D expenditure by funding sector in 2016
1) Incl. private non-profit sector
Figure 3a. GDP share of R&D expenditure in certain EU countries in 2010 to 2015
Partly estimates or provisional values.
Source: OECD, Main Science and Technology Indicators.
Figure 3b. GDP share of R&D expenditure in certain OECD and other countries in 2010 to 2015
Partly estimates or provisional values.
Source: OECD, Main Science and Technology Indicators.
1.3. R&D expenditure is falling in Pirkanmaa, growing in North Ostrobothnia
The expenditure of R&D practised in the region of Uusimaa amounted EUR 2.9 billion in 2016, which is 49 per cent of R&D expenditure in the whole country. The share rose by one percentage point from 2015. R&D expenditure in North Ostrobothnia was EUR 690 million and in Pirkanmaa EUR 670 million and their shares of expenditure in the whole country were 12 and 11 per cent, respectively. Varsinais-Suomi included, the share of the four biggest regions was nearly 80 per cent of R&D expenditure in the entire country. R&D expenditure in Uusimaa remained in practice unchanged, while in Pirkanmaa it fell by EUR 100 million or by 13 per cent compared with 2015. R&D expenditure grew by five per cent in North Ostrobothnia from the year before.
Government sector research is centred in Uusimaa, where, measured by expenditure, 64 per cent of R&D work was performed. In the higher education sector, research was more evenly divided between regions. Forty per cent of research was performed in Uusimaa. The shares of Varsinais-Suomi and Pirkanmaa were 12 per cent and that of North Ostrobothnia nine per cent.
1.4. Extramural research amounted to EUR 370 million
Extramural R&D activity refers to entire R&D projects or undertakings contracted out by the enterprise or organisation, which are not service purchases of own R&D activities or support functions. The coverage of the collected data is limited, because the statistics on research and development relate to enterprises or organisations practising R&D activities, so units only contracting R&D are excluded.
A total of EUR 370 million of extramural research was reported, EUR 100 million from abroad (Appendix table 2). Enterprises’ purchases corresponded to 90 per cent of the whole volume. In the higher education sector, research is contracted out quite rarely. Domestic enterprises made up 54 per cent of service providers, totalling EUR 200 million. In this role, the higher education sector is also significant, as research services performed by domestic higher education institutions amounted to EUR 35 million.
1) Government administrative branches and private non-profit institutions
2) Estimated based on survey responses and other calculations
3) Share of domestic enterprises in funding, funding by foreign enterprises belongs to the category foreign countries
4) Source: OECD, Main Science and Technology Indicators (http://www.oecd.org/science/inno/msti.htm)
Source: Research and development 2016, Statistics Finland
Inquiries: Ari Leppälahti 029 551 3237, Heidi Pirkola 029 551 3246, Mervi Härkönen 029 551 3254, tiede.teknologia@stat.fi
Director in charge: Sami Saarikivi
Updated 26.10.2017
Official Statistics of Finland (OSF):
Research and development [e-publication].
ISSN=2342-6721. 2016,
1. Research and development 2016
. Helsinki: Statistics Finland [referred: 22.2.2026].
Access method: http://stat.fi/til/tkke/2016/tkke_2016_2017-10-26_kat_001_en.html

