1. Research and development 2020
1.1. Nine per cent increase in enterprises’ R&D personnel
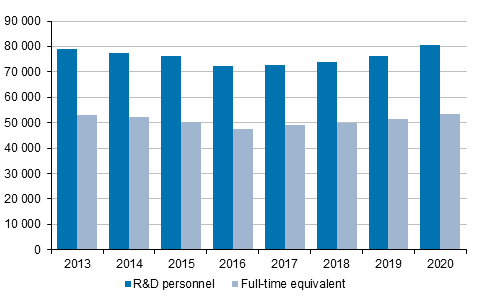
In 2020, altogether 80,560 persons were employed in research and product development tasks, 52 per cent of them in enterprises, 39 per cent in higher education establishments and nine per cent in the government sector. The total number of R&D personnel increased by 4,350 from the year before, that is, by nearly six per cent. Enterprises’ R&D personnel grew by 3,450 persons, or nine per cent, while the growth in higher education (2.6%) and the government sector (1.5%) was more moderate. The proportion of women in R&D personnel remained unchanged and stood at 35 per cent. The share of women varies by sector, in enterprises women's share of R&D personnel was around one fifth, in the government sector the share was 47 per cent and in the higher education sector 51 per cent. Seventy-six per cent of the R&D personnel were researchers and R&D engineers, while the rest were engaged in various expert or support tasks related to R&D activity. In higher education, the share of researchers was 78 per cent and in enterprises 75 per cent.
R&D personnel are highly educated, 20 per cent have a doctorate level degree. In addition, two-thirds have some other university or university of applied sciences degree. Slightly more than two-thirds of the doctors engaged in research and development worked in higher education, 18 per cent in enterprises and 14 per cent in the government sector.
R&D in full-time equivalents amounted to 53,500 in 2020. The number rose by around 2,000 full-time equivalents from the previous year, which means an increase of nearly four per cent. Working hours spent on R&D activities increased by six per cent in enterprises. In the government sector the growth was 4.2 per cent and in the higher education sector R&D in full-time equivalents remained practically unchanged. Fifty-nine per cent of the full-time equivalents were carried out in enterprises, 32 per cent in the higher education sector and the remaining nine per cent in the government sector.
Figure 1. R&D personnel and R&D in full-time equivalents in 2013 to 2020
1.2. R&D expenditure grew only in enterprises
The total sum of research and product development expenditure was EUR 6,930 million in 2020, which is nearly EUR 220 million more than in the year before. In all, expenditure grew by 3.2 per cent. However, growth occurred only in enterprises where expenditure went up by 5.4 per cent from 2019. In higher education, expenditure remained unchanged, while in the government sector R&D expenditure contracted by 2.8 per cent. R&D expenditure is estimated 1) to amount to nearly EUR 7.2 billion in 2021. The GDP share is estimated to remain at 2.9 per cent.
Table 1. Research and development expenditure by sector and share of gross domestic product in 2012 to 2020 and an estimate for the year 2021
| Year | Sector | Total | Share of R&D in GDP 2) | ||||||
| Business enterprise sector | Government sector 1) | Higher education sector | |||||||
| EUR mil. | % | EUR mil. | % | EUR mil. | % | EUR mil. | % | % | |
| 2012 | 4,695.0 | 68.7 | 662.2 | 9.7 | 1,474.6 | 21.6 | 6,831.9 | 100.0 | 3.40 |
| 2013 | 4,602.4 | 68.9 | 643.6 | 9.6 | 1,438.1 | 21.5 | 6,684.2 | 100.0 | 3.27 |
| 2014 | 4,409.5 | 67.7 | 613.1 | 9.4 | 1,489.5 | 22.9 | 6,512.1 | 100.0 | 3.15 |
| 2015 | 4,047.3 | 66.7 | 543.1 | 8.9 | 1,480.5 | 24.4 | 6,070.9 | 100.0 | 2.87 |
| 2016 | 3,901.7 | 65.8 | 534.6 | 9.0 | 1,489.8 | 25.1 | 5,926.1 | 100.0 | 2.72 |
| 2017 | 4,028.3 | 65.3 | 577.7 | 9.4 | 1,567.2 | 25.4 | 6,173.2 | 100.0 | 2.73 |
| 2018 | 4,226.9 | 65.7 | 587.2 | 9.1 | 1,623.8 | 25.2 | 6,437.9 | 100.0 | 2.76 |
| 2019 | 4,407.9 | 65.6 | 602.6 | 9.0 | 1,704.6 | 25.4 | 6,715.1 | 100.0 | 2.80 |
| 2020 | 4,644.2 | 67.0 | 585.6 | 8.4 | 1,702.8 | 24.6 | 6,932.6 | 100.0 | 2.94 |
| 2021 3) | 4,862.4 | 68.0 | 609.6 | 8.5 | 1,683.7 | 23.5 | 7,155.7 | 100.0 | 2.88 |
2) GDP 2019-2020 Statistics Finland preliminary figures, GDP 2021 forecast of Ministry of Finance.
3) Estimate based on survey responses and other calculations.
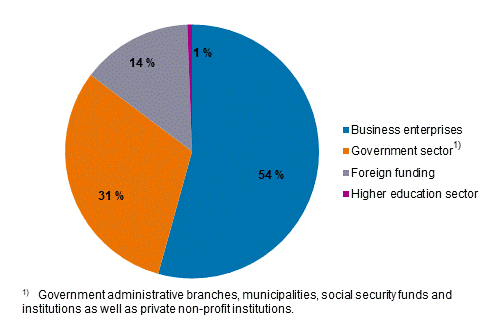
In 2020, enterprises accounted for 67 per cent of R&D expenditure and domestic enterprises for 54 per cent of funding of expenditure. Enterprises’ share of R&D expenditure rose by 1.4 percentage points from 2019, as a funder the growth was 1.8 percentage points. The government sector, in turn, is responsible for eight per cent of the expenditure, but in funding the share of central government and other public institutions is 29 per cent and that of private non-profit activities close on two per cent. The higher education sector accounts for one-fourth of R&D expenditure, but its share as a funder is under one per cent. The share of foreign sources in the funding of R&D expenditure is 14 per cent.
Of R&D expenditure, 54 per cent comprised remuneration expenditure, 40 per cent other current expenditure and the remaining six per cent acquisition costs of fixed assets. The expenditure item distribution was very similar in the three main sectors, slight differences were mainly seen in fixed investments, their share was seven per cent of R&D expenditure in enterprises and three per cent in higher education.
Figure 2a. Distribution of R&D expenditure by performer sector in 2020
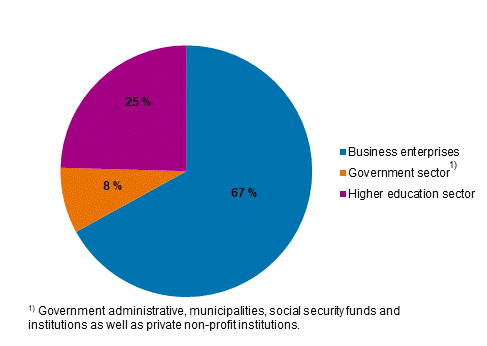
Figure 2b. Distribution of R&D expenditure by funding sector in 2020
1.3. Four largest regions account for 80 per cent of research and development expenditure
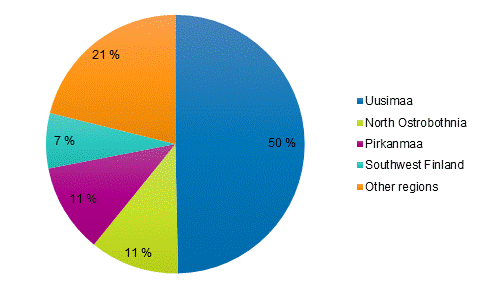
The expenditure of R&D practised in the region of Uusimaa amounted to EUR 3,444 million in 2020, which is one-half of R&D expenditure in the whole country. R&D expenditure in North Ostrobothnia was EUR 775 million and in Pirkanmaa EUR 772 million, the share of both regions of expenditure in the whole country was around 11 per cent. Including Southwest Finland, the share of the four biggest regions was nearly 80 per cent of R&D expenditure in the entire country.
Figure 3. Distribution of R&D expenditure by region in 2020
Government sector research is centred in Uusimaa, the region’s share of R&D expenditure in the sector was 70 per cent. Thirty-nine per cent of research in the higher education sector was carried out in Uusimaa, the share of Southwest Finland was 12 per cent, that of Pirkanmaa 11 per cent and that of North Ostrobothnia nine per cent. Of enterprises’ R&D expenditure slightly more than one-half was directed at Uusimaa. The shares of Pirkanmaa and North Ostrobothnia were 12 per cent each.
The higher education sector accounted for 25 per cent of the research input in the entire country, but the relative importance of the higher education sector on regional research and development activities varies strongly. The share of higher education institutions of the region's R&D expenditure is over one-half in North Karelia (58%), Lapland (55%) and South Savo (53%). By contrast, in Uusimaa and North Ostrobothnia, for example, the share of the higher education sector in R&D expenditure was around one-fifth.
Among the regions of Mainland Finland, R&D activity was most enterprise-driven in Ostrobothnia (enterprises’ share 85%), in Satakunta (78%) and in North Ostrobothnia (74%). The shares of enterprises' R&D were lowest in the region of Lapland, 32 per cent, and in North Karelia, 35 per cent.
1.4. Extramural research and development by R&D performers amounted to nearly EUR 390 million
Extramural R&D activity refers to entire R&D projects or undertakings contracted out by the enterprise or organisation, which are not service purchases or support functions related to own R&D activities. The compilation of statistics on extramural R&D is restricted to organisations with their own R&D activities.
A total of EUR 386 million of extramural research was reported in 2020. Enterprises' purchases made up 90 per cent of the total volume. In the higher education sector, research is rarely contracted out, about EUR three million. Domestic enterprises provided 48 per cent, or EUR 187 million, of the extramural research and development. Extramural research and development from abroad totalled EUR 133 million. Higher education establishments are also significant providers of research services, domestic higher education establishments provided extramural R&D to the tune of EUR 36 million.
1.5. Finland's R&D intensity exceeds the international average
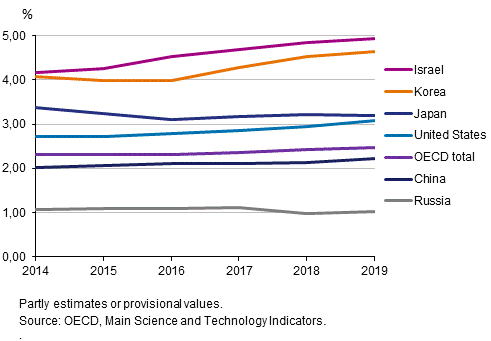
In the comparison data compiled by the OECD, Finland’s GDP share of R&D expenditure was 2.8 per cent in 2019. Finland's GDP share of R&D expenditure is higher than the average for the OECD and EU countries. Of the European Union’s gross domestic product, 2.1 per cent was spent on research and development in 2019. The corresponding share for the OECD area was 2.5 per cent. The most R&D intensive countries in the OECD area in 2019 were Israel (4.9%) and South Korea (4.6%). The GDP share of R&D expenditure in Sweden and Finland were still on the same level in 2014, but after that, Finland's R&D expenditure has decreased and Sweden's R&D expenditure has increased, so the GDP share is clearly higher in Sweden than in Finland, that is, 3.4 per cent in 2019. 2)
Figure 4a. GDP share of R&D expenditure in certain European countries in 2014 to 2019
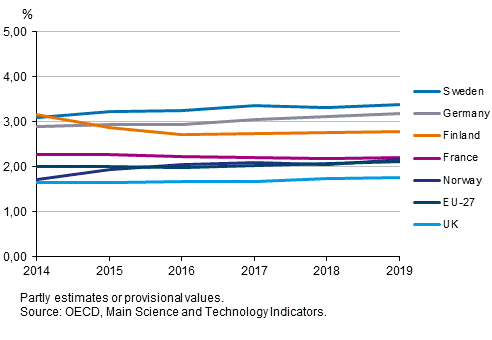
Figure 4b. GDP share of R&D expenditure in certain OECD and other countries in 2014 to 2019
1) Estimated based on survey responses and other calculations
2) OECD, Main Science and Technology Indicators, OECD figures for Finland may differ slightly from the nationally published.
Source: Research and development 2020, Statistics Finland
Inquiries: Ari Leppälahti 029 551 3237, Heidi Pirkola 029 551 3246, tiede.teknologia@stat.fi
Head of Department in charge: Katri Kaaja
Updated 28.10.2021
Official Statistics of Finland (OSF):
Research and development [e-publication].
ISSN=2342-6721. 2020,
1. Research and development 2020
. Helsinki: Statistics Finland [referred: 16.2.2026].
Access method: http://stat.fi/til/tkke/2020/tkke_2020_2021-10-28_kat_001_en.html

