Published: 14 June 2019
International trade in services grew in the first quarter of 2019
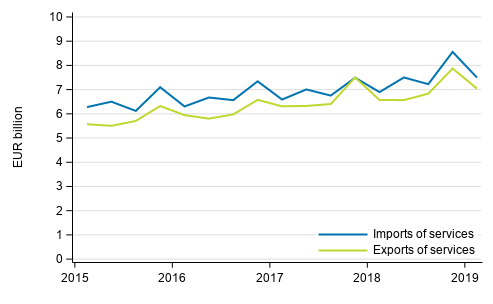
Service exports grew by seven per cent in the first quarter of 2019 compared with the corresponding quarter of the previous year. Service imports grew by nine per cent. Service exports mainly grew due to the increased exports of ICT services, construction services and project deliveries. In imports, growth was more broad-based. These data derive from Statistics Finland's statistics on international trade in goods and services, which are part of balance of payments .
Figure 1. Imports and exports of services quarterly

The combined exports of goods and services grew by five per cent and imports by one per cent in the first quarter of 2019 compared with the corresponding quarter in 2018. Goods exports grew by four per cent. In contrast, goods imports fell by two per cent.
Finland exports ICT services and imports other business services
In the first quarter of 2019, the most significant service items in international trade were other business services, telecommunications, computer and information services (ICT) and transport services. Together, these services form around 60 per cent of Finland’s service exports and 65 per cent of the service imports.
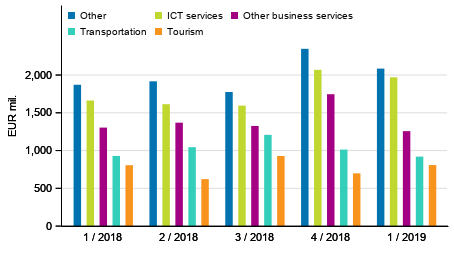
Imports of other business services amounted to EUR 2.3 billion and exports to EUR 1.3 billion. International trade in transport services was also in deficit. Imports of transport services amounted to EUR 1.4 billion and exports to EUR 0.9 billion. In contrast, more ICT services were exported than imported. The exports of these amounted to EUR 2.0 billion and imports to EUR 1.1 billion.
Growth in international trade especially due to ICT services
Service exports grew due to increased exports of ICT services. In addition, exports of construction services and project deliveries increased. Exports of the first mentioned item grew by 18 per cent and that of the latter by 27 per cent. Measured in euros, however, the growth in exports of ICT services was double compared to construction services and project deliveries.
ICT services include, for example, hardware and software consultancy and implementation services, general software that increase business productivity and computer game software.
The imports of almost every service item grew or remained on level with the previous year in the first quarter of the year. Growth was strongest in the ICT services, other business services and financial and insurance services items.
Figure 2. Exports of services by service item

The United States’ share of Finland’s international trade grew in the first quarter of 2019
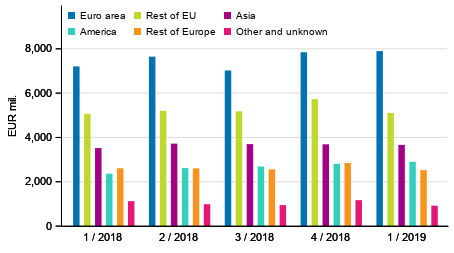
The United States’ share of Finland’s service exports was around 12 per cent in the first quarter of 2019. The share of both goods and services exports to the United States grew by good one percentage point compared to the previous year. In contrast, the share of the euro area in service exports fell by around one percentage point to 30 per cent.
The share of total imports from the United States increased to nearly five per cent. The increase in service imports from the United States explains the slight growth, of under one percentage point, in the share of imports. In contrast, the share of the euro area of total imports remained at around 40 per cent, as one year before.
Over two-thirds of Finland’s exports were exported to Europe, and almost 80 per cent of the goods and services imported to Finland were imported from Europe. The share of the euro area of Finland’s international trade with Europe was around one-half in the first quarter of 2019.
Great Britain’s share of Finland’s exports still five per cent
Great Britain’s share of Finland’s exports, that is, the combined exports of goods and services, was around five per cent in the first quarter of 2019. The share remained on level with the previous year.
Goods amounting to nearly EUR 0.8 billion were exported to Great Britain in the first quarter of 2019 and the first quarter of 2018. Less services were exported, amounting to EUR 0.3 billion. Less than one-third of Finland’s exports to Great Britain were thus services, both in the first quarter of 2019 and that of 2018.
Equal amounts of goods and services imported from Great Britain
Great Britain’s share in Finland’s imports remained on level with the previous year, at around four per cent. Services were imported to Finland from Great Britain to the amount of around EUR 0.5 billion in the first quarter of 2019, as in the year before. In the same period, goods were also imported to the value of EUR 0.5 billion.
Finland’s imports from Great Britain increased by EUR 56 million. The share of service imports of this growth was EUR 40 million. In percentages, total imports increased by six per cent during the first three months of 2019 compared to the corresponding period one year earlier.
Figure 3. Exports of goods and services in balance of payments terms by area

Statistics on international trade
The statistics on international trade in goods and services are
part of balance of payments .
The statistics comprise breakdowns of goods and services on a more
detailed level. The guidelines and recommendations of the Balance
of Payments Manual (BPM6) applied to balance of payments are
consistent with the European System of Accounts (ESA 2010).
National Accounts are published on quarterly and annual levels . Finnish
Custom s publishes data on goods trade across borders. Goods
trade published by Finnish Customs is used as source data for the
statistics on international trade in goods and services. Removals
and additions caused by definitions are made to them to achieve
goods trade in balance of payments terms.
Finnish Customs’ statistical service, tilastot@tulli.fi, +358
29 552 335.
Source: International trade in goods and services 2019, Statistics Finland
Inquiries: Tommi Kaatrasalo 029 551 3320, Terhi Tulonen 029 551 3604, globalisaatio.tilastot@stat.fi
Director in charge: Ville Vertanen
Publication in pdf-format (269.6 kB)
- Tables
-
Tables in databases
Pick the data you need into tables, view the data as graphs, or download the data for your use.
Appendix tables
- Revisions in these statistics
-
- Revisions in these statistics (14.6.2019)
Updated 14.6.2019
Official Statistics of Finland (OSF):
International trade in goods and services [e-publication].
ISSN=2343-4244. 1st quarter 2019. Helsinki: Statistics Finland [referred: 23.2.2026].
Access method: http://stat.fi/til/tpulk/2019/01/tpulk_2019_01_2019-06-14_tie_001_en.html

