

Published: 17 December 2021
Goods exports grew past pre-pandemic levels in the third quarter of 2021 but service exports did not
In the third quarter of the current year, international trade continued to grow. Combined exports of goods and services grew by as much as EUR 5.0 billion relative to the third quarter of 2020, while imports of goods and services grew by EUR 4.1 billion. In the light of current data, growth was even higher in the past quarter than in the second quarter of 2021 when exports and imports increased by EUR 3.4 billion and 3.5 billion, respectively. Exports had recovered in the third quarter of 2021 even to the extent that the combined value of exports of goods and services was EUR 1.6 billion higher than in the third quarter of 2019. These data derive from Statistics Finland's statistics on international trade in goods and services, which are part of balance of payments .
Figure 1. Imports and exports of services quarterly
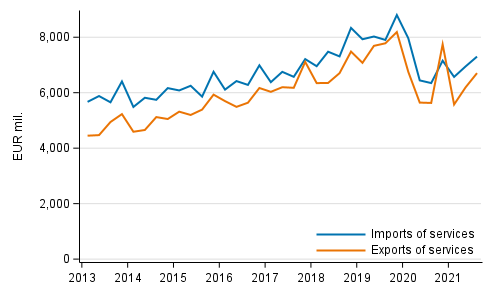
However, the situation of goods exports and service exports was not quite similar in the third quarter of 2021. The value of goods exports grew by just short of EUR 4.0 billion relative to the corresponding quarter in the year before and by EUR 2.7 billion relative to the situation two years ago. The growth in goods exports was thus so strong that goods exports did not just return to their pre-pandemic level but even exceeded it. A further indication of the singularity of the situation is that according to the balance of payments time series starting from 2006, the level of goods exports was last higher than this in the second quarter of 2008.
Although the level of service exports improved by EUR 1.1 billion from the respective quarter of the year before, EUR 1.1 billion were missing from the value of service exports compared to the corresponding quarter of two years before. Thus, in a certain sense service exports recovered only halfway.
The development of goods and service imports is not exactly the same as in exports. In the third quarter of 2021, goods imports were nearly EUR 3.2 billion higher than in the corresponding quarter of the year before and nearly EUR 1.6 billion higher than in the corresponding quarter of two years ago. Similarly to goods exports, goods imports also recovered and passed the level prior to the pandemic, but to a lesser extent.
Service imports, in turn, grew by close on EUR 1.0 billion during the past quarter relative to the third quarter of 2020. Compared with the corresponding quarter of 2019, service imports decreased by EUR 0.6 billion. Thus, the level of service imports was somewhat closer to the level of the third quarter of 2019 than service exports.
Transport and travel services still behind weaker development in international trade in services
As was already noted in earlier quarters and the releases relating to them, the weak development especially in transport and travel services explains the lower level of international trade in services in the third quarter of 2021 as well.
The combined exports of transport and travel services grew in the past quarter by close on EUR 0.3 billion compared with the third quarter of 2020. Thus, some recovery took place, but in turn, compared to the third quarter of 2019, the value of exports of transport and travel services was still EUR 1.3 billion lower. In other words, the value of exports of transport and travel services was in the past quarter only 45 per cent of its value two years ago.
The situation was similar in imports of transport and travel services. Compared to one year ago, their combined value grew by EUR 0.4 billion but the value of imports declined by close on EUR 1.2 billion from two years ago.
Exports of telecommunications, computer and information services grew again
The development was more favourable for other service exports as a whole. Compared with the third quarter of 2020, the growth in the exports of these service items was EUR 0.8 billion. In addition, unlike in transport and travel services, other service exports also grew by EUR 0.2 billion compared to the third quarter of 2019. The level of exports of telecommunication, computer and information services (TCI) was clearly higher in the past quarter than usual, which mostly explains the positive development.
Exports of TCI also underpinned the high level of service exports in the last quarter of 2020, although then its value was higher than that of the past quarter. Thus, the value of TCI exports in the third quarter of 2021 was EUR 3.1 billion. Compared with the previous year, the service item grew by EUR 0.7 billion and by EUR 0.4 billion from two years before. Compared to the third quarter of 2019, the growth in TCI exports compensates for the weaker development of other service items.
Figure 2. Exports of services by service item
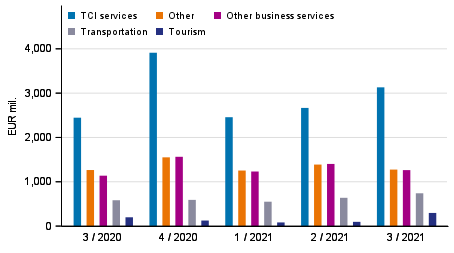
The value of manufacturing services decreased by EUR 0.1 billion from two years ago and the value of the service item was also lower than in the third quarter of 2020. The value of exports of other business services was nearly EUR 0.1 billion lower than two years ago, but compared with last year, EUR 0.1 billion more of these services were exported from Finland. Although these service items did not show a corresponding growth as TCI exports, their lower level relative to the time before the pandemic did not have as big an impact as the contraction of transport and travel services.
If imports of transport and travel services are excluded, imports of other services grew in the past quarter by EUR 0.5 billion compared to the third quarter of 2020 and by nearly EUR 0.6 billion compared to the third quarter of 2019. In other words, if the imports of transport services and Finnish travel abroad had been on the pre-pandemic level, Finland's total imports of services would have grown in the past quarter relative to the third quarter from two years ago. Thus, the lower level of service imports was mostly caused by transport and travel services. The same observation is also true for service exports.
The development of service imports was not consistent with service exports in that in terms of imports of different service items, growth in telecommunication, computer and information services was less significant. Products of other service items have also been imported to Finland more than in the third quarter of 2020 or 2019. Compared to the third quarter of 2020, TCI imports grew by close on EUR 0.1 billion, while imports of manufacturing services increased by EUR 0.1 billion. Imports of other business services grew most, by close on EUR 0.4 billion compared with the corresponding quarter in the previous year. Other business services have usually been the largest single item in service imports. The mentioned service items also explain the growth compared to the third quarter of 2019.
Exports especially to Europe and America have grown from the previous year
Thus, the value of combined exports of goods and services grew in the past quarter by around EUR five billion compared to the third quarter of 2020. The growth took place in a geographically large area so that exports to all continents improved compared with the situation one year ago. Measured in absolute terms, exports to Europe grew most, or by EUR 3.4 billion, which corresponds to two thirds of Finland's total growth in exports. In relative terms, exports to America increased most, by EUR 1.1 billion or 44 per cent relative to the third quarter of 2020. America's growth of good EUR one billion covers 23 per cent of the growth in total exports. Most of the growth is therefore explained by more favourable development in the European and American export markets.
Figure 3. Exports of goods and services in balance of payments terms by area
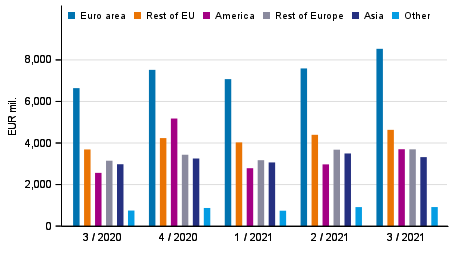
However, the content of the growth in exports was not entirely similar. In Europe, the growth was mainly caused by goods exports, which grew by EUR 3.0 billion, while service exports to Europe grew by EUR 0.4 billion. Services were of greater significance for the American export market, where exports grew by just short of EUR 0.8 billion. The value of goods exports to America grew by EUR 0.4 billion.
America's exports was mainly based on exports to the United States, which increased by close on EUR 1.1 billion. Despite the large growth, the level of exports did not reach the exceptionally high level of the end of 2020. In Europe, Finland's exports grew to Germany, the Netherlands, Russia and the United Kingdom alike. Exports to Sweden grew in particular, altogether by close on EUR 0.7 billion.
Growth in combined imports of goods and services was more centred on Europe than exports. If Finland's imports grew in total by EUR 4.1 billion, 77 per cent of this growth came from imports from Europe. Unlike exports, Asia was more important for the growth in imports. Imports from Asia increased by good EUR 0.6 billion, which corresponds to 16 per cent of the growth of total imports. Imports from America, in turn, grew to a lesser extent by EUR 0.3 billion.
Statistics on international trade
The statistics on international trade in goods and services are part of balance of payments . The statistics comprise breakdowns of goods and services on a more detailed level. The guidelines and recommendations of the Balance of Payments Manual (BPM6) applied to balance of payments are consistent with the European System of Accounts (ESA 2010). National Accounts are published on quarterly and annual levels . Finnish Customs publishes data on goods trade across borders. Goods trade published by Finnish Customs is used as source data for the statistics on international trade in goods and services. Removals and additions caused by definitions described in the quality description are made to them to achieve goods trade in balance of payments terms.
Finnish Customs’ statistical service, tilastot@tulli.fi, +358 29 552 335.
Source: International trade in goods and services 2018, Statistics Finland
Inquiries: Kasperi Lavikainen 029 551 3674, globalisaatio.tilastot@stat.fi
Head of Department in charge: Katri Kaaja
Publication in pdf-format (278.7 kB)
- Tables
-
Tables in databases
Pick the data you need into tables, view the data as graphs, or download the data for your use.
Appendix tables
- Revisions in these statistics
-
- Revisions in these statistics (17.12.2021)
Updated 17.12.2021
Official Statistics of Finland (OSF):
International trade in goods and services [e-publication].
ISSN=2343-4244. 3rd quarter 2021. Helsinki: Statistics Finland [referred: 16.7.2026].
Access method: http://stat.fi/til/tpulk/2021/03/tpulk_2021_03_2021-12-17_tie_001_en.html