

Published: 15 March 2022
Finland's international trade grew compared to the year before in the last quarter of 2021
In the last quarter of 2021, the combined exports of goods and services grew by EUR 5.4 billion compared to the corresponding quarter of 2020. Around three-quarters of this growth originated from exports of goods. Although the growth in exports of services was relatively smaller, exports did, however, grow by EUR 1.4 billion compared to the corresponding quarter in the previous year. Compared to the last quarter of 2020, the combined imports of goods and services grew even more than exports, by EUR 7.1 billion. The shares of goods and services in the growth were the same as in exports, that is, around 75 per cent was due to imports of goods and 25 per cent by imports of services. These data derive from Statistics Finland's statistics on international trade in goods and services, which are part of balance of payments .
Figure 1. Imports and exports of services quarterly
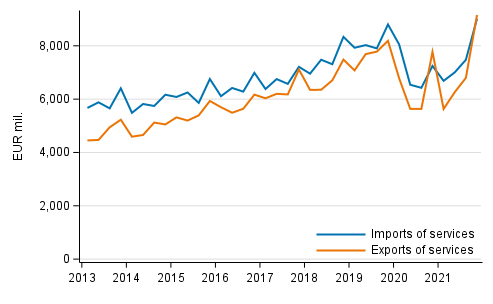
It should be noted that Finland's international trade did not grow only relative to the last quarter of 2020. The value of exports and imports also grew compared to the last quarter of 2019, when the pandemic caused by the coronavirus did not yet have an effect on economic life. The value of goods exports grew by EUR 3.5 billion compared to the situation two years ago, while the value of service exports increased by around EUR one billion. Imports of services, in turn, grew only by EUR 0.2 billion. However, it could be said that the value of service imports was at least on the same level as prior to the pandemic, although growth compared to the situation two years ago was not that big. In the past quarter, the value of goods imports was EUR 4.1 billion higher than two years earlier.
Exports of telecommunications, computer and information services again on high level
When viewing the figures for different quarters of 2021, exports of telecommunications, computer and information services (TCI) seem to have grown steadily. The difference to the last quarter of 2020 is again smaller because exports of the service item were also on a high level at that time. According to the present data, TCI exports grew by EUR 0.5 billion compared to those top figures as well. Compared to the last quarter of 2019, the growth amounted to close on EUR 1.5 billion. TCI exports have also previously been the biggest service item in Finland's exports of services.
Figure 2. Exports of services by service item
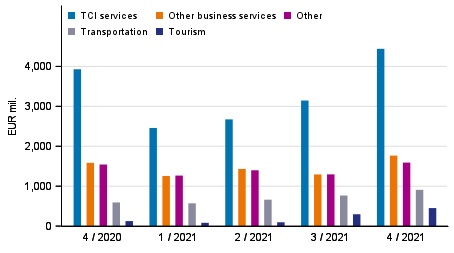
The impact of the pandemic on international trade in services has been strong especially in transport and travel services. There were indications in the past quarter that exports of these service items had recovered. Compared to the last quarter of 2020, their combined exports grew by good EUR 0.6 billion, or even more than TCI exports. Compared to the last quarter of 2019, around EUR 0.5 billion less transport and travel services were exported, however, so it is not yet possible to talk about full recovery.
Most of the growth in service exports is thus explained by the high level of TCI exports and the partial recovery of exports of transport and travel services. Compared to one year ago, the value of exports of professional and management consulting services and of charges collected for the use of intellectual property also rose, but only by around EUR 0.1 billion for both service items. Exports of any service item did not decline by EUR 0.1 billion or more compared to the last quarter of 2020.
In comparison to the last quarter of 2020, imports of services grew by a total of EUR 1.8 billion in the past quarter. The combined imports of transport and travel services covered EUR 0.8 billion of this growth. Imports of transport services were roughly on level with the situation two years ago, while imports of travel services were still on a lower level. The value of Finns’ expenditure on foreign travel was around EUR 0.7 billion lower than in the last quarter of 2019.
Compared to the last quarter of 2020, imports of other business services also grew clearly, or by EUR 0.7 billion, in the last quarter of 2021. Imports of the service item were also higher than in the last quarter of 2019. In other service items, changes compared to one year ago were smaller, although imports of manufacturing services grew by close on EUR 0.2 billion.
Growth of exports centred on Europe
If total exports of goods and services grew by EUR 5.4 billion relative to the last quarter of 2020, the growth in exports to Europe covered 90 per cent of this, or EUR 4.8 billion. The value of exports to EU countries grew by EUR 4.0 billion from one year ago, which represented around 84 per cent of total exports growth. Especially exports to Sweden and the Netherlands grew compared to the last quarter of 2020. Growth was lower in other continents than Europe. Exports to Asia grew by close on EUR 0.4 billion, which was more than the growth of exports to the American continent, which amounted to EUR 0.1 billion.
Figure 3. Exports of goods and services in balance of payments terms by area
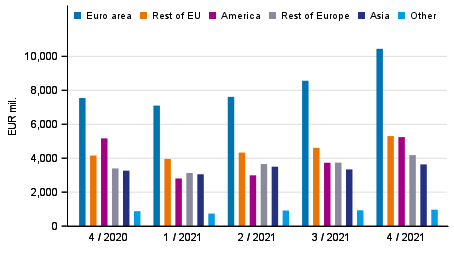
Growth in imports of goods and services was not equally centred on Europe or EU countries in the last quarter of 2021. Thus, the total value of imports grew by EUR 7.1 billion compared to the last quarter of 2020 and just under one-half of this growth came from EU countries. Imports from Asia grew by close on EUR 1.5 billion and imports from Russia were also EUR 1.5 billion larger in value in the past quarter than one year earlier. Compared to the last quarter of 2019 prior to the pandemic, the value of imports from Russia was EUR 0.7 billion higher in the last quarter of 2021.
Statistics on international trade
The statistics on international trade in goods and services are part of balance of payments . The statistics comprise breakdowns of goods and services on a more detailed level. The guidelines and recommendations of the Balance of Payments Manual (BPM6) applied to balance of payments are consistent with the European System of Accounts (ESA 2010). National Accounts are published on quarterly and annual levels . Finnish Customs publishes data on goods trade across borders. Goods trade published by Finnish Customs is used as source data for the statistics on international trade in goods and services. Removals and additions caused by definitions described in the quality description are made to them to achieve goods trade in balance of payments terms.
Finnish Customs’ statistical service, tilastot@tulli.fi, +358 29 552 335.
Source: International trade in goods and services 2018, Statistics Finland
Inquiries: Kasperi Lavikainen 029 551 3674, globalisaatio.tilastot@stat.fi
Head of Department in charge: Katri Kaaja
Publication in pdf-format (272.7 kB)
- Tables
-
Tables in databases
Pick the data you need into tables, view the data as graphs, or download the data for your use.
Appendix tables
- Revisions in these statistics
-
- Revisions in these statistics (15.3.2022)
Updated 15.03.2022
Official Statistics of Finland (OSF):
International trade in goods and services [e-publication].
ISSN=2343-4244. 4th quarter 2021. Helsinki: Statistics Finland [referred: 16.7.2026].
Access method: http://stat.fi/til/tpulk/2021/04/tpulk_2021_04_2022-03-15_tie_001_en.html