Published: 21 March 2014
Economic dependency ratio rose in 2012
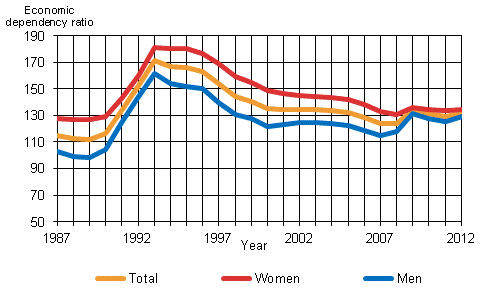
According to the data of Statistics Finland's employment statistics for the year 2012, the economic dependency ratio rose by 2.5 percentage points from the previous year. In 2012, there were 132 non-employed persons per one hundred employed persons. During the period from 1987 to 2012, the dependency ratio has been at its highest in the year of recession, 1993 (172). At its lowest, the dependency ratio was in 1989, when there were 112 non-employed per one hundred employed persons.
Economic dependency ratio by sex in 1987–2012

The economic dependency ratio is calculated by dividing the number of non-employed, that is, unemployed and inactive population, by the number of employed persons. The figure obtained is multiplied by one hundred. A fall in the economic dependency ratio is thus considered a positive and desirable occurrence and a rise a negative one. In addition to variations in economic cycles and development of employment, the economic dependency ratio is affected by the birth rate, ageing of the population and migration.
During the period from 1987 to 2012, the economic dependency ratio was at its lowest (112) in 1989 and at its highest (172) in the early 1990s in the year of recession 1993, when the number of unemployed persons exceeded 535,000. Between 1992 and 1993, the economic dependency ratio rose by 19 percentage points. After the recession, the economic dependency ratio went down, but the figures of the end of the 1980s have not been reached. In the 2000s, the dependency ratio has been at its lowest in 2007 (124). The level of 2012 (132) was last attained in 2005.
Examined by sex, the differences between the economic dependency ratio have narrowed particularly since 2009. Over the whole reference period, the ratio of non-employed men to employed men has been lower than that for women (including all persons not of working age as well). In 2012, there were 129 non-employed men per one hundred employed men. The corresponding figure for women was 134.
The difference between the dependency ratios of men and women was at its largest in 1997 (30 percentage points) and at its smallest in 2009 and 2012 (five percentage points). The economic dependency ratio of men rose by nearly four percentage points from 2011, while for women the figure was around one percentage point higher than one year earlier.
Differences between sexes in the economic dependency ratio are explained particularly by women's longer lifetime. The poor employment development of conventional male fields, such as the forest industry, is visible in men's economic dependency ratio.
Data prior to 2005 have been made comparable by transferring employed persons aged 15 to 17 into the group of non-employed persons. After the review of the retirement age in 2005, data on employment of under-age people have not been obtained for the employment statistics. The transfer is visible in this release mainly in the region-level comparison: economic dependency ratios are slightly higher than in the figures calculated before the transfer.
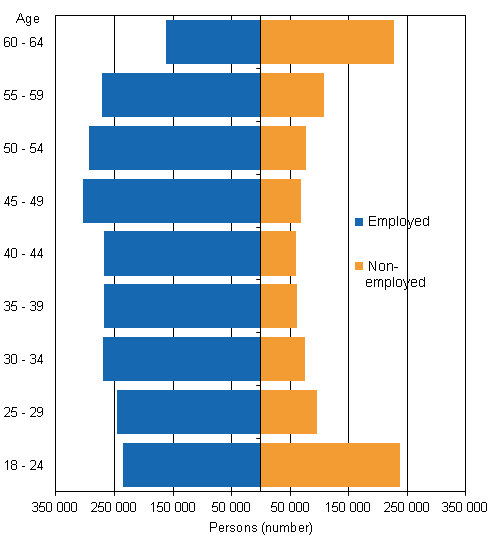
In 2012, the economic dependency ratio of those aged 18 to 64 was 44, that is, there are 1.3 million more employed than non-employed persons. The economic dependency ratios were highest for those aged 60 to 64 (141) and those aged 18 to 24 (101), most of whom were students. The economic dependency ratio was around 23 in the 35 to 39, 40 to 44 and 45 to 49 age groups.
Employed and non-employed by age group in 2012

Large regional differences
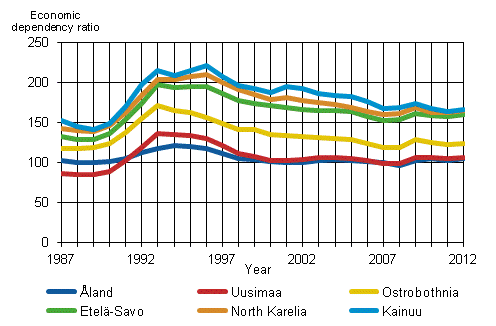
In 2012, the economic dependency ratios were highest in the regions of Kainuu (167), North Karelia (165) and Etelä-Savo (160). In Åland (105), Uusimaa (107) and Ostrobothnia (123) the economic dependency ratios were lowest. Compared with 2011, the economic dependency ratio rose most in Varsinais-Suomi and North Ostrobothnia (five percentage points). In Pohjois-Savo, Ostrobothnia and Central Ostrobothnia the rise amounted to one percentage point.
In Åland and Uusimaa the economic dependency ratio has remained under 110 throughout the 2000s. In Kainuu, the economic dependency ratio has been the highest of the whole country throughout the reference period from 1987 to 2012.
Economic dependency ratio between 1987 to 2012 in three regions with the highest and lowest dependency ratios in 2012

Source: Employment Statistics, Statistics Finland
Inquiries: Jaana Huhta 09 1734 2632, tyossakaynti@stat.fi
Director in charge: Riitta Harala
Publication in pdf-format (313.1 kB)
- Tables
-
Tables in databases
Pick the data you need into tables, view the data as graphs, or download the data for your use.
Appendix tables
- Figures
Updated 21.3.2014
Official Statistics of Finland (OSF):
Employment [e-publication].
ISSN=2323-6825. Background information on unemployed persons 2012. Helsinki: Statistics Finland [referred: 5.2.2026].
Access method: http://stat.fi/til/tyokay/2012/03/tyokay_2012_03_2014-03-21_tie_001_en.html

