Published: 2 November 2018
Share of professionals biggest for Germans and Indians
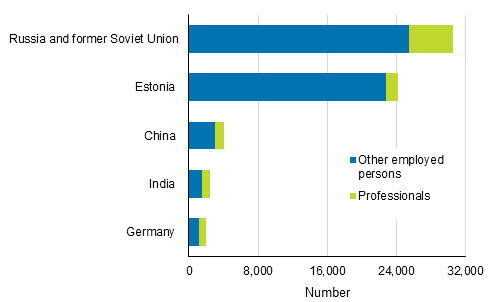
According to Statistics Finland's employment statistics, the ten biggest occupational groups of employed persons with German and Indian background included several professional level occupational groups in 2016. Forty-three per cent of those with German background and 40 per cent of those with Indian background worked as professionals. In absolute numbers, most professionals with foreign background were of Russian background, 5,100 persons.
Professionals and persons with foreign background by country

The number of employed persons with foreign background was 133,000 in 2016. The number of employed persons with foreign background grew by 32,000 from 2011 to 2016, and their share of all employed persons was around six per cent, up by 1.6 percentage points.
For employed persons with foreign background, the most common background country was Russia or the former Soviet Union, around 30,500 (up by 3,200 from 2011, 12%). The next biggest background countries based on the number of employed persons were Estonia (24,200, up by 7,800, 48%), former Yugoslavia (4,200, up by 900, 26%), China (4,000, up by 900, 30%) and Vietnam (3,900, up by 1,400, 55%).
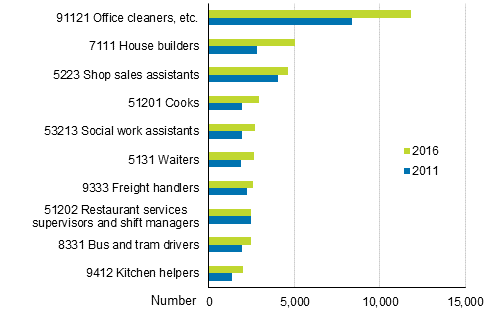
Examined by background country, foreign persons worked in numbers most as office cleaners (11,800 persons, up by 41% compared with 2011). Other typical occupational groups for persons with foreign background were house builders (5,000, up by 80%), shop sales assistants (4,600, up by 15%), cooks (2,900, up by 50%), and social work assistants (2,700, up by 39%).
Common occupational groups for several background countries were, for example, practical nurses, other healthcare workers and home helpers, as well as freight handlers and warehouse workers.
Professionals with foreign background worked as software and applications developers and analysts, university and higher education teachers, medical doctors and engineering professionals.
The occupational group of managers was among the ten most common occupational groups, for example, for those with Turkish and Indian background (Classification of Occupations, 3-digit level). Those with Turkish background worked as hotel and restaurant managers, and those with Indian background as information and communications technology service managers.
Most common occupational groups of employed persons with foreign background in 2016 compared with 2011 (Classification of Occupations 2010)

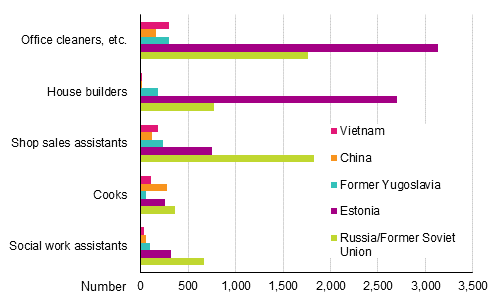
A majority of office cleaners and house builders with foreign background were of Estonian origin, while the most common background country for shop sales assistants was Russia (incl. former Soviet Union) and the most common background country for restaurant services supervisors and shift managers was Turkey.
Seventy-six per cent of restaurant services supervisors and shift managers of foreign background and some 20 per cent of house builders were entrepreneurs.
Among medical doctors of foreign origin, some 40 per cent were of Russian origin or from the area of the former Soviet Union. Nearly 50 per cent of building frame and related trades workers with foreign background were of Estonian background.
Five most common occupational groups of employed persons with foreign background and five biggest background countries in year 2016

In relative terms, there were more persons with foreign background than with Finnish background as craft and related trades workers, service and sales workers and under the section elementary occupations of the Classification of Occupations. In addition to cleaners, freight handlers, hospital and institutional helpers, kitchen helpers and paper deliverers, messengers, etc. are included in elementary occupations.
In Statistics Finland's employment statistics for 2016, the occupations of wage and salary earners and entrepreneurs aged 18 to 74 according to their main employment relationship in the last week of the year have been classified into occupational groups according to the Classification of Occupations 2010. 1)
1) Occupation data are produced primarily based on a person's main employment in the last week of the year.
Source: Employment Statistics, Statistics Finland
Inquiries: Juho Keva 029 551 3601, Elina Mikkelä 029 551 2973, info@stat.fi
Director in charge: Jari Tarkoma
Publication in pdf-format (339.3 kB)
- Reviews
- Tables
-
Tables in databases
Pick the data you need into tables, view the data as graphs, or download the data for your use.
Appendix tables
- Appendix table 1. Most common occupational groups among employed persons aged 18 to 74 with foreign origin in 2016, % (2.11.2018)
- Appendix table 2. Most common occupational groups among employed persons aged 18 to 74 with foreign origin in 2016 The ten largest background countries based on the number of employed persons of foreign background have been selected for (2.11.2018)
- Appendix table 3. Employed persons aged 18 to 74, share of entrepreneurs among the employed and proportion of the unemployed among the labour force by background country in 2016 1) (2.11.2018)
Updated 2.11.2018
Official Statistics of Finland (OSF):
Employment [e-publication].
ISSN=2323-6825. Industry, employer sector and jobs 2016. Helsinki: Statistics Finland [referred: 5.2.2026].
Access method: http://stat.fi/til/tyokay/2016/04/tyokay_2016_04_2018-11-02_tie_001_en.html

