Published: 21 October 2021
Large regional differences in the number of employed persons in industries with the highest and lowest pay levels in 2019
According to Statistics Finland’s employment statistics, 303,100 persons worked in industries with a pay level of over EUR 4,000 and 333,300 in industries with a pay level of under EUR 3,000 in 2019. In relative terms, the biggest number of persons working in industries with the highest pay level were living in Uusimaa and the smallest in South Ostrobothnia and South Savo. In relative terms, the largest number of persons working in industries with the lowest pay level were living in Kainuu and Lapland and the smallest in Åland and Central Finland.
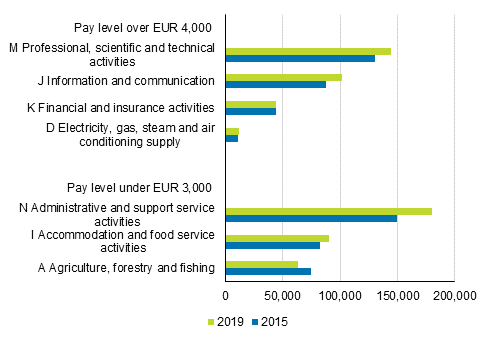
Number of employed persons in industries with the highest and lowest pay levels in 2015 and 2019

In all, 29,100 (11%) more persons worked in industries with the highest pay level in 2019 than in 2015. The highest pay level industries include information and communication, financial and insurance activities, professional, scientific and technical activities, and electricity, gas, steam and air conditioning supply. According to Statistics Finland's structure of earnings statistics, the average of total earnings of full-time wage and salary earners in these industries was over EUR 4,000 in 2019. The average of total earnings is used as a measure of the pay level because it describes in which industries the most wages and salaries are paid in relative terms and in which industries the least.
Altogether 21,400 (7%) more persons worked in industries with the lowest pay level in 2019 than in 2015. The lowest pay level industries include agriculture, forestry and fishing 1) , accommodation and food service activities, and administrative and support service activities. The average of total earnings of full-time wage and salary earners in these industries was under EUR 3,000 in 2019.
In industries with the highest pay level, the number of employed persons grew most in professional, scientific and technical activities, where 14,600 (11%) more persons worked than in 2015. In industries with the lowest pay level, the number of employed persons grew most in administrative and support service activities, where 30,000 (20%) more persons worked than in 2015. By contrast, the number of employed persons decreased by 11,000 in agriculture, forestry and fishing.
Altogether 70 per cent (1,737,100) of all employed persons worked in industries where the pay level was EUR 3,000 to 4,000. There were 66,500 (4%) more persons working in these industries in 2019 than in 2015. The number of employed persons in this group grew most in human health and social work activities, where 22,600 (6%) more persons worked in 2019 than in 2015.
Most persons working in industries with the highest pay levels in Uusimaa in relative terms
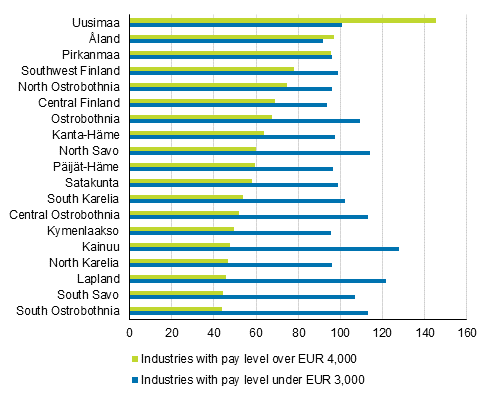
Examined by region, most persons working in industries with the highest pay level were living in Uusimaa in relative terms in 2019. Per 1,000 persons of the same age, 146 persons aged 18 to 64 working in these industries were living in Uusimaa 2) . In relative terms, the next highest numbers of persons aged 18 to 64 working in industries with the highest pay level were living in Åland and Pirkanmaa; in Åland 97 and in Pirkanmaa 95 per 1,000 persons of the same age.
In relative terms, the lowest numbers of persons working in industries with the highest pay level were living in South Ostrobothnia and South Savo. In all, 44 persons aged 18 to 64 per 1,000 persons of the same age working in these industries were living in both of these regions. This figure was also under 50 in Lapland, North Karelia and Kainuu.
When examining Mainland Finland, the number of persons aged 18 to 64 working in industries with the highest pay level was relatively highest in Uusimaa, Pirkanmaa, Southwest Finland, North Ostrobothnia and Central Finland. These regions include Finland’s seven largest towns: Helsinki, Espoo, Tampere, Vantaa, Oulu, Turku and Jyväskylä. In relative terms, Ostrobothnia, the location of Vaasa, the 15th largest town in Finland, had almost as many persons aged 18 to 64 working in industries with the highest pay level as Central Finland.
Employed persons aged 18 to 64 in industries with the highest and lowest pay levels per 1,000 persons of the same age by region in 2019

In relative terms, most persons working in industries with the lowest pay level were living in Kainuu; 128 employed persons aged 18 to 64 per 1,000 persons of the same age. After Kainuu, the number of persons working in industries with the lowest pay level was in relative terms highest in Lapland. In relative terms, the lowest number of those working in industries with the lowest pay level were living in Åland and Central Finland; in Åland 92 and in Central Finland 94 employed persons aged 18 to 64 per 1,000 persons of the same age.
There were 45 more persons aged 18 to 64 per 1,000 persons of the same age working in industries with the highest pay level living in Uusimaa than in industries with the lowest pay level. In addition to Uusimaa, this difference was similar only in Åland. By contrast, all other regions had more persons aged 18 to 64 working in industries with the lowest pay level than in industries with the highest pay level. This difference was biggest in Kainuu, where it was 80 employed persons per 1,000 persons of the same age and smallest in Pirkanmaa, where it was nearly zero.
1) Wage and salary earners in agriculture, forestry and fishing are poorly represented in the structure of earnings statistics (1,700 wage and salary earners in 2019).
2) Persons aged 18 to 74 can be defined as employed persons in the employment statistics. However, persons age over 64 were excluded from the regional examination. Their share is around one per cent of all employed persons.
Source: Employment Statistics, Statistics Finland
Inquiries: Meri Raijas 029 551 3061, Jukka Tapio , info@stat.fi
Head of Department in charge: Hannele Orjala
Publication in pdf-format (228.2 kB)
- Tables
-
Tables in databases
Pick the data you need into tables, view the data as graphs, or download the data for your use.
Appendix tables
Updated 21.10.2021
Official Statistics of Finland (OSF):
Employment [e-publication].
ISSN=2323-6825. Background information on unemployed persons 2019. Helsinki: Statistics Finland [referred: 5.2.2026].
Access method: http://stat.fi/til/tyokay/2019/03/tyokay_2019_03_2021-10-21_tie_001_en.html

