1. The decline in employment halted in 2010
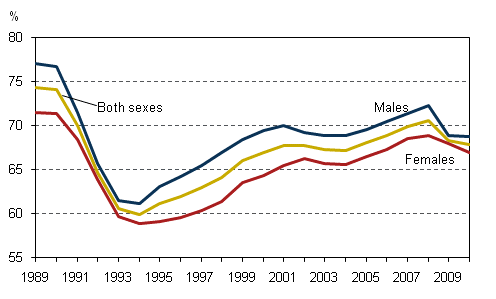
The decline in employment halted in 2010. At 67.8 per cent, the employment rate was only 0.5 percentage points lower in 2010 than in 2009. The employment rate was now at the same level as in 2002.
Men's employment rate was 68.7 per cent. No appreciable change from the previous year took place in the employment rate. Women's employment rate fell by one percentage point to 66.9 per cent. There is still only a minor difference of under two percentage points in the employment rate between men and women. (Figure 1.)
Figure 1. Employment rate by sex in 1989–2010, persons aged 15 to 64, %
In 2010, the average number of employed persons was 2,447,000, which was 10,000 lower than in 2009. The decline in employment almost levelled off in 2010, as in 2009 the number of employed persons had decreased by 74,000. In 2010, the number of employed persons was at the same level as in 2006 (Figure 2). Compared to the quarters of 2009, employment decreased in the first two quarters of 2010 but began to show growth in the third and last quarters.
Figure 2. Number of employed persons by sex in 1989–2010, persons aged 15 to 74
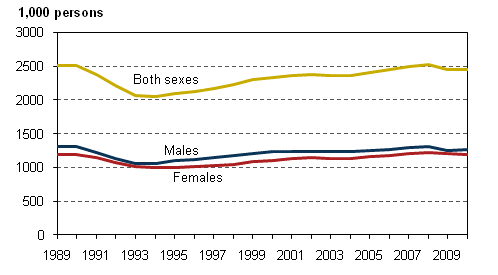
There were 2,120,000 employees in 2010, which was almost the same number as one year earlier. While in 2009 the number of self-employed persons grew by 10,000 persons, in 2010 their number turned to a decline. The number decreased by 7,000 persons. There were 328,000 self-employed persons and assisting family members in 2010. The share of assisting family members of this total was 14,000. The average share of self-employed persons among employed persons was 13.4 per cent.
Men's employment situation improved
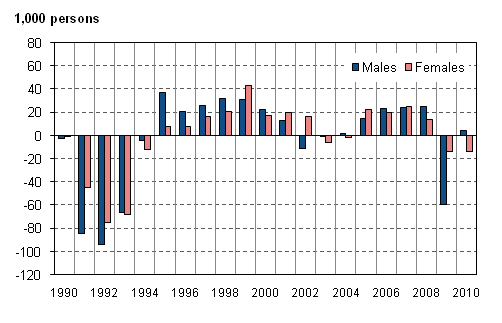
Men's employment began to show slight growth in 2010. Figure 3 shows a time series over 20 years on changes in the number of employed persons by gender. Whereas a steep drop (–60 000) can be seen in the number of employed men in 2009, the situation was distinctly brighter in 2010. Men's employment improved by 4,000 persons. The number of employed women fell by further 14,000, or by as much as in the previous year.
The same phenomenon can be seen in the development of the number of employed persons over the 2009–2010 period as in the years from 1991 to 1994. Then, too, men's employment worsened more sharply than women's but then correspondingly improved faster than women's. After economic downturns women's employment improves at a longer lag.
Figure 3. Change from the previous year in the number of employed persons by sex in 1990–2010, persons aged 15 to 74
Employment decreased in manufacturing, and in health and social work
Figure 4 shows change from the previous year in the number of employed persons by industry in 2009 and 2010. Employment continued to decrease most in manufacturing where the number of employed persons fell by 18,000 from the previous year. The vast majority of them were men (–15,000). Employment also weakened in human health and social work (–10,000) whereas in 2009 employment in these industries was still growing. Employment increased most in education, which employed 10,000 persons more than in 2009. Changes in employment were minor in other industries.
Employment declined in the private sector. The number of persons employed in the private sector fell by 19,000. In the public sector the number of employed persons grew by 6,000. Employment increased in the local government sector which employed 8,000 persons more than in the previous year.
Examined by socio-economic group, employment decreased most among manual workers and lower-level employees. The largest individual groups in which employment decreased were male manual workers in manufacturing (–12,000 persons), and female lower-level employees in human health and social work activities (–8,000). By contrast, employment among upper-level employees grew by 23,000 persons, the majority of them men.
Figure 4. Change from the previous year in the number of employed persons by industry in 2009–2010, persons aged 15 to 74
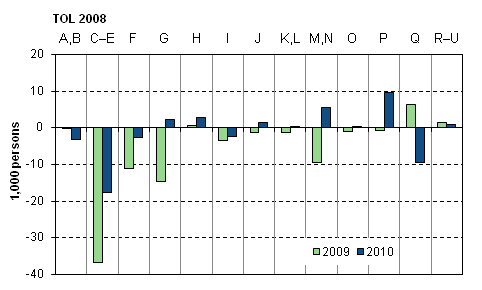
Industrial Classification (TOL 2008)
| A, B | 01–09 | Agriculture, forestry and fishing; mining and quarrying |
| C-E | 10–39 | Manufacturing; electricity, gas, steam and air conditioning and watersupply; sewerage and waste management |
| F | 41–43 | Construction |
| G | 45–47 | Wholesale and retail trade; repair of motor vehicles and motorcycles |
| H | 49–53 | Transportation and storage |
| I | 55–56 | Accommodation and food service activities |
| J | 58–63 | Information and communication |
| K, L | 64–68 | Financial, insurance and real estate activities |
| M, N | 69–82 | Professional, scientific and technical activities; administrativeand support service activities |
| O | 84 | Public administration and defence; compulsory social security |
| P | 85 | Education |
| Q | 86–88 | Human health and social work activities |
| R–U | 90–99 | Arts, entertainment and recreation; other service activities |
Number of hours worked increased slightly
The bottoming out of the economic downturn can also be seen in the number of hours worked by employed persons. The number of hours worked by employed persons was one per cent higher in 2010 than in 2009. As the number of employed persons remained almost unchanged, the amount of labour input per employed persons increased slightly in 2010. In 2010, the average annual number of hours worked by an employed person was 1,633, whereas in 2009 the respective figure was 1,611 hours per year.
The growth in the number of hours worked was also due to a reduction in the number of temporary lay-offs. In 2010, the average number of laid-off persons was 21,000, while the same number in the previous year was 37,000. Compared to the quarters of the year before, the number of temporarily laid-off persons decreased in every quarter of the year. In the first quarter the reduction in the number of laid-off persons was still quite small but in the subsequent quarters the number decreased clearly. In the second quarter of 2010, the number of laid-off persons was already 23,000 lower than in the respective quarter of the year before. (Table 1.)
Table 1. Number of temporarily laid-off persons 2008–2010 by quarter
| Quarter | 2008 | 2009 | 2010 |
| I | 7,000 | 38,000 | 35,000 |
| II | 4,000 | 42,000 | 19,000 |
| III | 4,000 | 31,000 | 15,000 |
| IV | 14,000 | 36,000 | 14,000 |
| Annual mean | 7,200 | 37,000 | 21,000 |
There were fewer underemployed persons, that is, persons who would like to do more work than is available, in 2010 than one year earlier. While in 2009, underemployed persons numbered 133,000, in 2010 the figure had fallen to 120,000.
Employment improved slightly in the oldest age groups
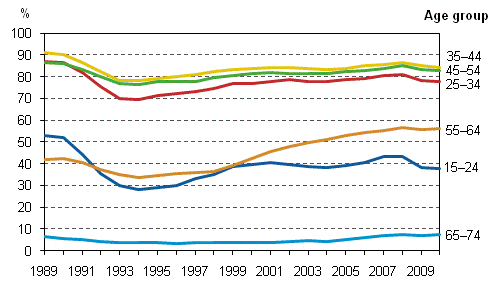
Changes in employment have been quite small in the different age groups (Figure 5). The number of employed persons decreased most in the 34 to 45 age group. This age group had 16,000 fewer employed persons in 2010 than in the previous year. The employment rate for the age group fell by 1.3 percentage points. By contrast, employment increased slightly in the oldest age groups. There were 14,000 more employed persons in the 55 to 64 age group in 2010 than in the previous year. The employment rate for this age group was 56.2 per cent. The number of employed persons also went up slightly in the oldest age group of 65 to 74-year-olds. Changes in the employment rates by age group were minor; however, the rate rose a fraction for the oldest age groups and respectively fell for the youngest ones. The employment rate among persons aged between 20 to 64 was 72.8 per cent.
Since the review of retirement age in 2005, the effective retirement age has been flexible between 63 and 68 year. Employment in this age group has been showing growth although compared with younger age groups employment in the group is still minor. The employment rate for the group has risen from around 12 per cent in 2005 to 18 per cent or so in 2010. Employed persons in the age group numbered 67,000 in 2010, while the respective figure in 2005 was 36,000.
Figure 5. Employment rates by age group in 1989–2010, %
Source: Labour Force Survey 2010. Statistics Finland
Inquiries: Anna Pärnänen (09) 1734 2607, Heidi Melasniemi-Uutela (09) 1734 2523, tyovoimatutkimus@stat.fi
Director in charge: Riitta Harala
Updated 15.2.2011
Official Statistics of Finland (OSF):
Labour force survey [e-publication].
ISSN=1798-7857. 2010,
1. The decline in employment halted in 2010
. Helsinki: Statistics Finland [referred: 17.2.2026].
Access method: http://stat.fi/til/tyti/2010/tyti_2010_2011-02-15_kat_001_en.html

