

2. Changes in unemployment were minor in 2010
No appreciable changes took place in the unemployment situation between 2009 and 2010. In 2010, the average unemployment rate was 8.4 per cent, having been 8.2 per cent in 2009. Men’s unemployment rate was 9.1 per cent and women’s 7.6 per cent.
In 2010, the average number of unemployed persons was 224,000, which was 3,000 higher than in 2009. There were 126,000 unemployed men and 98,000 unemployed women. Compared to 2009, there were 4,000 more unemployed men. Hardly any change took place in the number of unemployed women.
Compared to the quarters of the previous year, the number of unemployed persons increased in the first quarter of 2010. In the last three quarters of the year the number of unemployed persons began to fall. Thus, early on in the year the employment situation was still deteriorating and unemployment worsening, but from there on the situation started to improve.
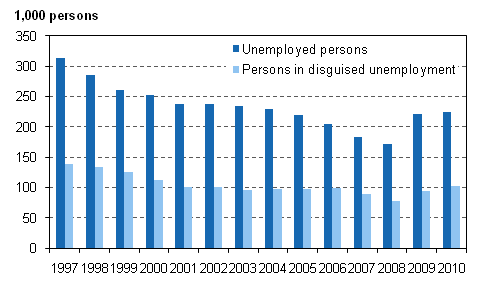
Besides unemployed persons, persons in disguised unemployment can also be regarded as jobless. Persons in disguised unemployment are economically inactive persons who would like to be gainfully employed but do not actively look for work for diverse reasons. In 2010, there were 102,000 persons in disguised unemployment, which is 8,000 more than in 2009. The numbers of persons in disguised unemployment were the highest in the 15 to 24 age group (32,000) and the 55 to 64 age group (25,000). The combined total number of unemployed persons and persons in disguised unemployment was 326,000 in 2010, which equals the level in 2004. (Figure 6.)
Figure 6. Unemployed persons and persons in disguised unemployment in 1997–2010, persons aged 15 to 74
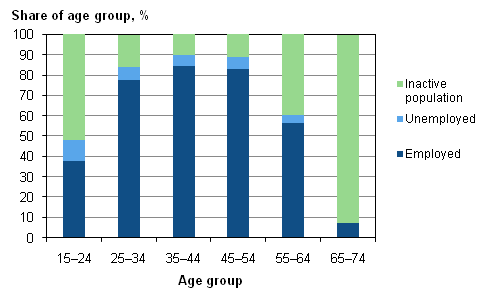
The changes in the unemployment rate were minor in all age groups between 2009 and 2010 (Figure 7). Measured with the unemployment rate, unemployment was still most widespread in the 15 to 24 age group. The unemployment rate for those aged 15 to 24 was 21.4 per cent in 2010. The number of unemployed young persons was also the highest, at 68,000, when compared to other ten-year age groups. However, it should be noted that the unemployment rate measures the share of unemployed persons of the active population. Because the majority of the young people in the 15 to 24 age group are students, i.e. economically inactive, this raises the unemployment rate. When the share of unemployed persons of the total age group is examined, we can see that one in ten of young persons between the ages of 15 and 24 were unemployed (Figure 8).
Figure 7. Unemployment rates by age group in 1989–2010, %
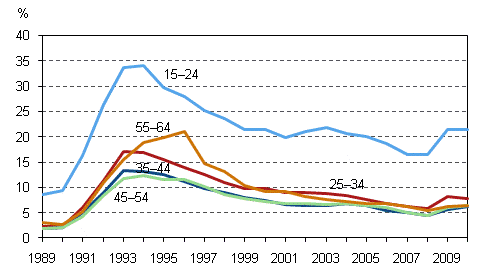
Figure 8. Shares of employed and unemployed persons and inactive population of age group in 2010, %
Source: Labour Force Survey 2010. Statistics Finland
Inquiries: Anna Pärnänen (09) 1734 2607, Heidi Melasniemi-Uutela (09) 1734 2523, tyovoimatutkimus@stat.fi
Director in charge: Riitta Harala
Updated 15.2.2011
Official Statistics of Finland (OSF):
Labour force survey [e-publication].
ISSN=1798-7857. 2010,
2. Changes in unemployment were minor in 2010
. Helsinki: Statistics Finland [referred: 3.8.2026].
Access method: http://stat.fi/til/tyti/2010/tyti_2010_2011-02-15_kat_002_en.html