1 Growth in employment slowed down in 2012
1.1 Number of employed persons grew slightly from the previous year
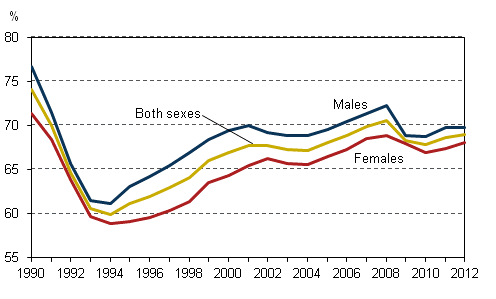
According to Statistics Finland’s Labour Force Survey, the employment rate rose slightly in 2012. At 69.0, the employment rate for the population aged 15 to 64 was 0.4 percentage points higher than in 2011. Men’s employment rate was 69.8 per cent and women’s 68.1 per cent. The employment rate for men remained unchanged, while that for women grew by 0.7 percentage points from 2011. (Figure 1.)
Population changes have an effect on the employment rate as well. The size of population aged 15 to 64, from which the official employment rate is calculated, diminished for the second year in a row. In 2012, the size of this age group was 3,524,000 persons, on average. The age group decreased in all by 30,000 persons in 2011 and 2012. In contrast, the number of working-age people (aged 15 to 74) continued to grow, because the number of those aged 65 to 74 went up by 30,000 in 2012.
Figure 1. Employment rates by sex in 1990–2012, persons aged 15 to 64, %
There were 2,483,000 employed persons in 2012, which was 10,000 more than in 2011. However, the number of employed persons was still lower than in 2008 (Figure 2). Compared to the quarters of 2011, employment increased in the first three quarters of 2012, but went down in the fourth quarter.
Figure 2. Number of employed persons by sex in 1990–2012, persons aged 15 to 74
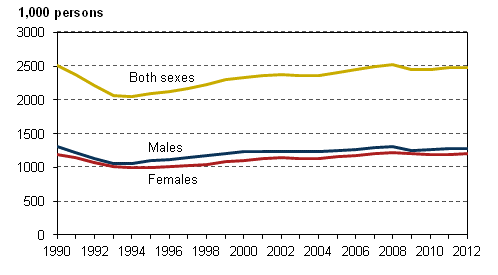
There were 2,146,000 employees in 2012, which figure is nearly the same as in the previous year. In turn, the number of self-employed persons grew slightly from 2011. In 2012, the total number of self-employed persons and unpaid family workers was 337,000. Of this, the share of unpaid family workers was 12,000. The average share of all self-employed persons among employed persons was 13.6 per cent.
1.2 Women's employment situation improved further
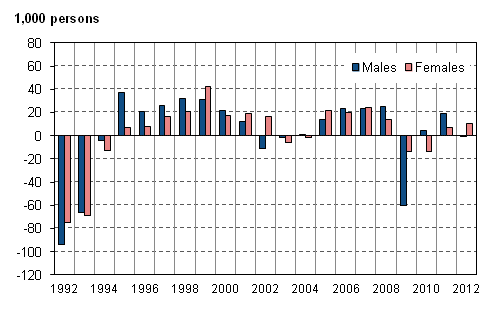
Women's employment rose further from 2011. The number of employed women went up by 10,000 in 2012. In turn, men's employment remained almost unchanged compared to 2011. Figure 3 shows a time series on changes in the number of employed persons by sex.
Figure 3. Change from the previous year in the number of employed persons by sex in 1992-2012, persons aged 15 to 74
1.3 Employment in the youngest and oldest age groups improved
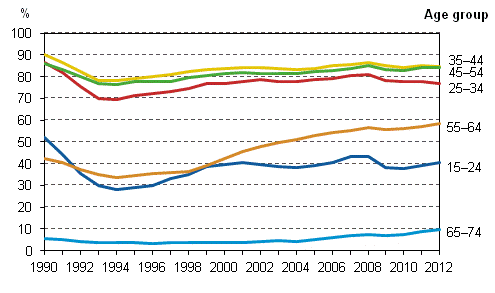
Changes in the employment of different age groups have been fairly small (Figure 4). The number of employed persons grew most in the 15 to 24 age group, by 10,000. The employment rate for the age group rose by 1.5 percentage points. Employment in the age group of those aged 65 to 74 has grown steadily, although employment in that group is still low compared to younger age groups. The number of employed persons aged 65 to 74 was 52,000 in 2012, which is 7,000 persons more than in the previous year. The size of population in this age group has also grown by 30,000 persons. Among 65 to 74-year-old employed persons, 57.2 per cent were self-employed.
Figure 4. Employment rates by age group in 1990–2012, %
1.4 Employment improved further in human health and social work activities
Figure 5 shows change from the previous year in the number of employed persons by industry in 2011 and 2012. In human health and social work activities (Q), the number of employed persons grew further by 13,000 persons in 2012. The number of employed persons in business activities (M, N) also increased by 9,000 persons.
Figure 5. Change from the previous year in the number of employed persons by industry in 2011-2012, persons aged 15 to 74
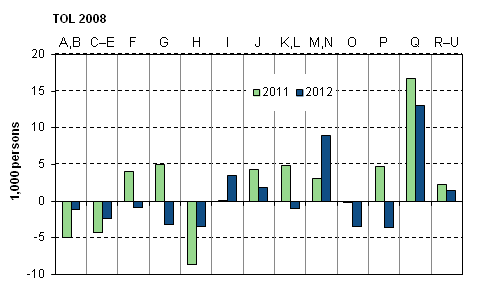
Industries (Standard Industrial Classification TOL 2008)
| A, B | 01–09 | Agriculture, forestry and fishing; mining and quarrying |
| C-E | 10–39 | Manufacturing; electricity, gas, steam and air conditioning and water supply; sewerage and waste management |
| F | 41–43 | Construction |
| G | 45–47 | Wholesale and retail trade; repair of motor vehicles and motorcycles |
| H | 49–53 | Transportation and storage |
| I | 55–56 | Accommodation and food service activities |
| J | 58–63 | Information and communication |
| K, L | 64–68 | Financial, insurance and real estate activities |
| M, N | 69–82 | Professional, scientific and technical activities; administrative and support service activities |
| O | 84 | Public administration and defence; compulsory social security |
| P | 85 | Education |
| Q | 86–88 | Human health and social work activities |
| R–U | 90–99 | Arts, entertainment and recreation; other service activities |
The rise in employment mainly concerned the private sector, which employed 12,000 persons more than in 2011. The number of employed persons in the public sector remained almost the same; the central government employed 7,000 fewer persons and the local government sector 6,000 more persons than in 2011.
1.5 Number of hours actually worked remained almost unchanged
In 2012, a total of 4.0 billion hours were worked in the national economy. The number of hours actually worked by employed persons was almost the same as in 2011. The number of hours actually worked per an employed person also remained nearly unchanged from the previous year. In 2011, the average annual number of hours actually worked by an employed person was 1,631, whereas in 2012 the respective figure was 1,627.
The number of underemployed persons fell somewhat from 2011. There were 110,000 underemployed persons in 2012. Underemployed persons refer to persons working involuntarily part-time or a shortened working week, for example.
Source: Labour Force Survey 2012. Statistics Finland
Inquiries: Pertti Taskinen 09 1734 2690, Joanna Viinikka 09 1734 3796, tyovoimatutkimus@stat.fi
Director in charge: Riitta Harala
Updated 5.3.2013
Official Statistics of Finland (OSF):
Labour force survey [e-publication].
ISSN=1798-7857. Employment and unemployment 2012,
1 Growth in employment slowed down in 2012
. Helsinki: Statistics Finland [referred: 10.2.2026].
Access method: http://stat.fi/til/tyti/2012/13/tyti_2012_13_2013-03-05_kat_001_en.html

