2 Employment and unemployment in 2012
2.1 Growth in employment slowed down in 2012
Number of employed persons grew slightly from the previous year
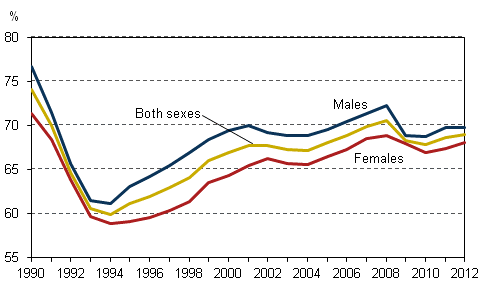
According to Statistics Finland’s Labour Force Survey, the employment rate rose slightly in 2012. At 69.0, the employment rate for the population aged 15 to 64 was 0.4 percentage points higher than in 2011. Men’s employment rate was 69.8 per cent and women’s 68.1 per cent. The employment rate for men remained unchanged, while that for women grew by 0.7 percentage points from 2011. (Figure 1.)
Population changes have an effect on the employment rate as well. The size of population aged 15 to 64, from which the official employment rate is calculated, diminished for the second year in a row. In 2012, the size of this age group was 3,524,000 persons, on average. The age group decreased in all by 30,000 persons in 2011 and 2012. In contrast, the number of working-age people (aged 15 to 74) continued to grow, because the number of those aged 65 to 74 went up by 30,000 in 2012.
Figure 1. Employment rates by sex in 1990–2012, persons aged 15 to 64, %
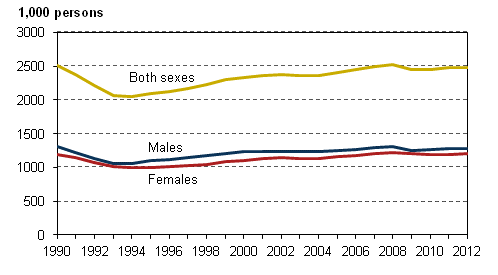
There were 2,483,000 employed persons in 2012, which was 10,000 more than in 2011. However, the number of employed persons was still lower than in 2008 (Figure 2). Compared to the quarters of 2011, employment increased in the first three quarters of 2012, but went down in the fourth quarter.
Figure 2. Number of employed persons by sex in 1990–2012, persons aged 15 to 74
There were 2,146,000 employees in 2012, which figure is nearly the same as in the previous year. In turn, the number of self-employed persons grew slightly from 2011. In 2012, the total number of self-employed persons and unpaid family workers was 337,000. Of this, the share of unpaid family workers was 12,000. The average share of all self-employed persons among employed persons was 13.6 per cent.
Women's employment situation improved further
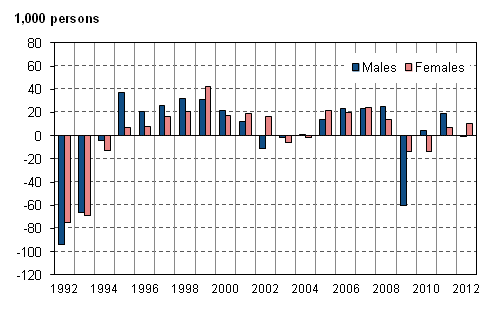
Women's employment rose further from 2011. The number of employed women went up by 10,000 in 2012. In turn, men's employment remained almost unchanged compared to 2011. Figure 3 shows a time series on changes in the number of employed persons by sex.
Figure 3. Change from the previous year in the number of employed persons by sex in 1992–2012, persons aged 15 to 74
Employment in the youngest and oldest age groups improved
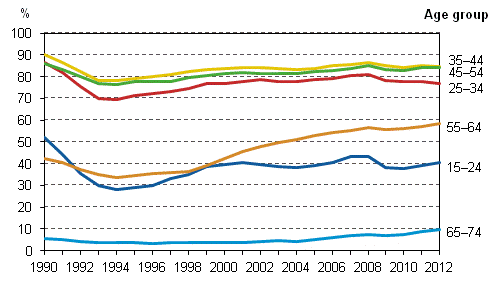
Changes in the employment of different age groups have been fairly small (Figure 4). The number of employed persons grew most in the 15 to 24 age group, by 10,000. The employment rate for the age group rose by 1.5 percentage points. Employment in the age group of those aged 65 to 74 has grown steadily, although employment in that group is still low compared to younger age groups. The number of employed persons aged 65 to 74 was 52,000 in 2012, which is 7,000 persons more than in the previous year. The size of population in this age group has also grown by 30,000 persons. Among 65 to 74-year-old employed persons, 57.2 per cent were self-employed.
Figure 4. Employment rates by age group in 1990–2012, %
Employment improved further in human health and social work activities
Figure 5 shows change from the previous year in the number of employed persons by industry in 2011 and 2012. In human health and social work activities (Q), the number of employed persons grew further by 13,000 persons in 2012. The number of employed persons in business activities (M, N) also increased by 9,000 persons.
Figure 5. Change from the previous year in the number of employed persons by industry in 2011-2012, persons aged 15 to 74
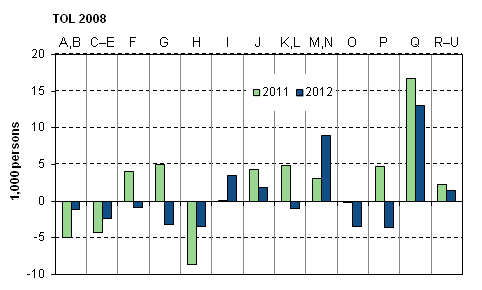
Industries (Standard Industrial Classification TOL 2008)
| A, B | 01–09 | Agriculture, forestry and fishing; mining and quarrying |
| C-E | 10–39 | Manufacturing; electricity, gas, steam and air conditioning and water supply; sewerage and waste management |
| F | 41–43 | Construction |
| G | 45–47 | Wholesale and retail trade; repair of motor vehicles and motorcycles |
| H | 49–53 | Transportation and storage |
| I | 55–56 | Accommodation and food service activities |
| J | 58–63 | Information and communication |
| K, L | 64–68 | Financial, insurance and real estate activities |
| M, N | 69–82 | Professional, scientific and technical activities; administrative and support service activities |
| O | 84 | Public administration and defence; compulsory social security |
| P | 85 | Education |
| Q | 86–88 | Human health and social work activities |
| R–U | 90–99 | Arts, entertainment and recreation; other service activities |
The rise in employment mainly concerned the private sector, which employed 12,000 persons more than in 2011. The number of employed persons in the public sector remained almost the same; the central government employed 7,000 fewer persons and the local government sector 6,000 more persons than in 2011.
Number of hours actually worked remained almost unchanged
In 2012, a total of 4.0 billion hours were worked in the national economy. The number of hours actually worked by employed persons was almost the same as in 2011. The number of hours actually worked per an employed person also remained nearly unchanged from the previous year. In 2011, the average annual number of hours actually worked by an employed person was 1,631, whereas in 2012 the respective figure was 1,627.
The number of underemployed persons fell somewhat from 2011. There were 110,000 underemployed persons in 2012. Underemployed persons refer to persons working involuntarily part-time or a shortened working week, for example.
2.2 Not much change in unemployment in 2012
No appreciable changes took place in unemployment between 2011 and 2012. In 2012, the average number of unemployed persons was 207,000. The number of unemployed men was 115,000 and that of women 92,000. The numbers of unemployed men and women remained almost on level with the previous year. The number of unemployed went down in the first two quarters, but grew in the third and fourth quarters when compared to 2011.
The rate of unemployment was, on average, 7.7 per cent in 2012, having been 7.8 per cent in 2011. Men’s unemployment rate was 8.3 per cent and women’s 7.1 per cent.
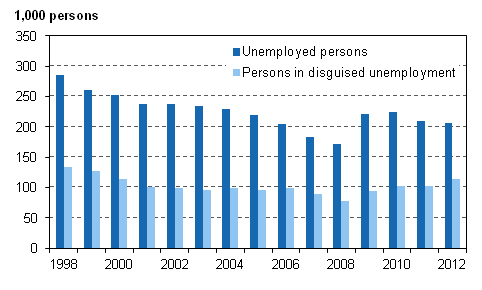
In 2012, besides unemployed persons there were 113,000 persons outside the labour force in so-called disguised unemployment, who would and could have accepted work, but had not looked for it actively. The number of persons in disguised unemployment grew by 10,000 from 2011. The numbers of persons in disguised unemployment were the highest in the 15 to 24 age group (35,000) and in the 55 to 64 age group (27,000). The combined total number of unemployed persons and persons in disguised unemployment was 320,000 in 2012 (Figure 6).
Figure 6. Unemployed persons and persons in disguised unemployment in 1998–2012, persons aged 15 to 74
The rate of unemployment, that is, the proportion of unemployed in the labour force, among young people aged 15 to 24 was 19.0 per cent in 2012. The proportion was 1.1 percentage points lower than in the previous year. In other age groups, rates of unemployment remained more or less unchanged (Figure 7). In the 15 to 24 age group, 63,000 were unemployed, being nearly one-third of all unemployed persons.
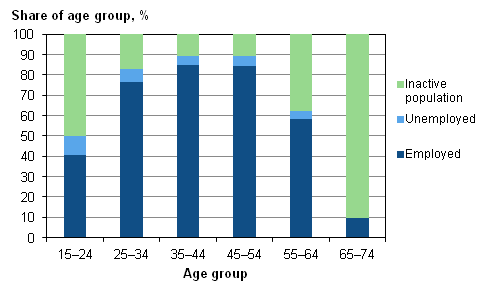
When examining the share of unemployed persons in the whole age group, around ten per cent of the 15 to 24 age group were unemployed (Figure 8). The shares of unemployed persons in the whole age group stayed in 2012 almost on level with 2011.
Figure 7. Unemployment rates by age group in 1990–2012, %
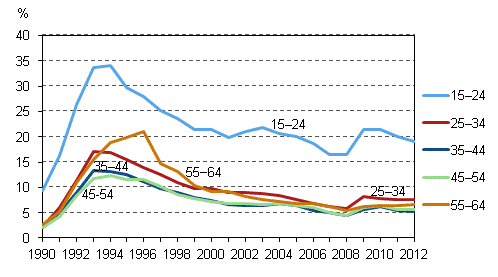
Figure 8. Shares of employed and unemployed persons, and inactive population of age group in 2012, %
There were an average of 12,000 temporarily laid-off persons in 2012, which was on level with the previous year. The numbers of laid-off persons also remained nearly the same as in the quarters of 2011. (Table 1.)
Table 1. Temporarily laid-off persons aged 15–74 by quarter in 2010–2012
| Year | |||
| 2010 | 2011 | 2012 | |
| Quarter | Persons | Persons | Persons |
| I | 35,000 | 18,000 | 17,000 |
| II | 19,000 | 11,000 | 10,000 |
| III | 15,000 | 9,000 | 9,000 |
| IV | 14,000 | 11,000 | 11,000 |
| Annual average | 21,000 | 12,000 | 12,000 |
In 2012, 25 per cent of the temporarily laid-off persons were defined as unemployed, 32 per cent as employed and 43 per cent as belonging to the inactive population.
2.3 Share of the active population on level with the previous year
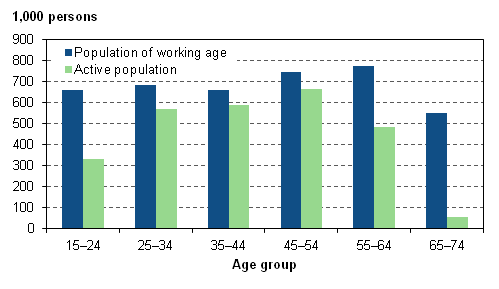
From 2011 to 2012, the size of the population of working age grew by 16,000 persons in Finland. In 2012, the size of Finland's population of working age, i.e. aged between 15 and 74, was 4,075,000 persons. Most grew the 65 to 74 age group, whose number increased by further 30,000 persons from the year before. The biggest age group among working-age population was formed by those aged 55 to 64 (Figure 9).
The share of the active population remained almost unchanged. The size of the active population grew by 8,000 persons in 2012. Between 2011 and 2012, the activity rate went up most in the 55 to 64 age group, by 1.4 percentage points.
The size of the inactive population was 1,385,000 in 2012. Its size grew by 8,000 persons from the previous year.
Figure 9. Population of working age and active population by age group in 2012
2.4 Number of employees working involuntarily in temporary jobs grew in 2012
Temporary employment contracts more usual among women than men
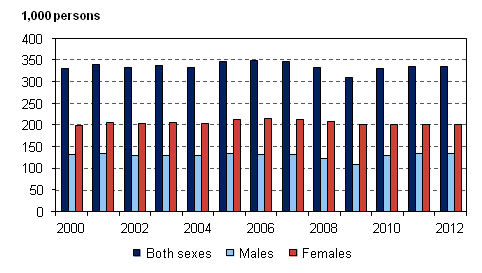
In 2012, the average number of employees in Finland was 2,146,000, which was more or less on level with one year earlier. In all, 336,000 employees had temporary employment contracts, of whom 202,000 were women and 134,000 men (Figure 10).
Figure 10. Number of temporary employees aged 15 to 74 by sex in 2000–2012
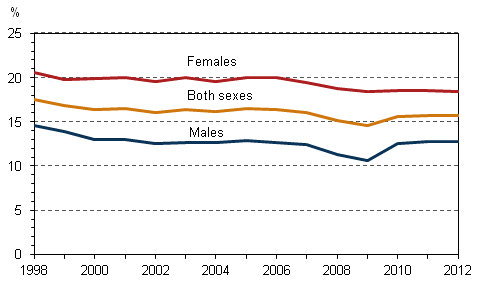
Eighty-four per cent of all employment contracts of employees were permanent and 16 per cent temporary in 2012. The shares were the same as in the previous year. The share of temporary employees was 18 per cent among female employees and 13 per cent among male employees. In recent years, the share of female temporary employees has been falling slowly. For men, the share of temporary employees was in 2012 still higher than in 2008 and 2009. (Figure 11.)
Figure 11. Share of temporary employees of all employees aged 15 to 74 by sex in 1998-2012, %
Two out of three temporary employees would want a permanent job
To an employee, temporary employment can be either a desired or involuntary form of employment. Approximately 25 per cent of temporary employees did not want a permanent job in 2012. The majority of them were aged between 15 and 24. Summer workers are a typical group of persons working voluntarily in temporary jobs.
However, a more common reason for working in a temporary employment relationship is that permanent work cannot be found. In 2012, the lack of permanent work was the reason why around 66 per cent of temporary employees worked in temporary jobs. The share of persons working involuntarily in temporary jobs among all temporary employees increased somewhat from 2011 to 2012.
In 2012, there were 221,000 temporary employees on the labour market who had not found a permanent job even though they would have wanted one. Of them, 137,000 were women and 83,000 men. One year before, the number of persons working involuntarily in temporary jobs was 208,000. Involuntary working under temporary contracts increases with age.
Around one-half of new employment contracts temporary
The number of employees with employment contracts of under one year's duration decreased slightly from 2011. In 2012, such employees numbered 435,000, or 11,000 fewer than in 2011. (Figure 12.)
Figure 12. Employees with employment contracts of under one year's duration in 2000-2012, persons aged 15 to 74

Fifty-three per cent of the employment contracts of under one year's duration were temporary. There has been a clear difference between women and men in whether a new employment relationship is temporary or permanent. In 2012, 59 per cent of women’s and 46 per cent of men’s new employment relationships were temporary.
One per cent of employees did temporary agency work
Temporary agency work refers to an employment relationship in which an employee works via an enterprise which intermediates or hires labour force. Data on temporary agency work have been collected in the Labour Force Survey since 2008. In 2012, the average number of persons doing temporary agency work was 27,000, or about the same as in 2011. The shares of men and women doing temporary agency work were almost equal.
Among all employees, the share of temporary agency workers was only one per cent or so in 2012. Thus, doing temporary agency work is quite a marginal form of working on the Finnish labour market. Temporary agency work is most commonly done by young people: around five per cent of 15 to 24-year-old employees were doing it.
Temporary agency workers are employed by several industries. Their use is most usual in wholesale and retail trade, in hotel and restaurant activities and in manufacturing. Each of these industries employed a couple of thousand temporary agency workers.
2.5 Growth in the number of part-time employees slowed down
Number of part-time employees highest in female-dominated industries
According to the Labour Force Survey, 374,000 employed persons worked part-time in 2012. Some 15 per cent of all employed persons worked part-time. Of them, 311,000 were employees. The Labour Force Survey data on part-time employment is based on the respondents’ own reporting. The following only concerns part-time employees.
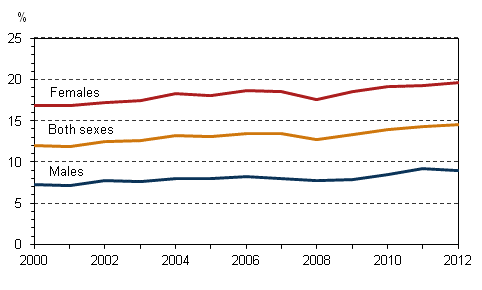
The number of part-time employees grew slightly (+4,000) in 2012 from the previous year. The long-term trend in part-time employment has been a growing one since 1997. Part-time employment is more widespread among women than men. Persons employed part-time numbered 216,000, or 20 per cent, among female employees and 95,000, or nine per cent, among male employees. From the previous year, the number grew for female employees, but not for male ones. (Figures 13 and 14.)
Nearly three-quarters of the part-time employees worked in the private sector. The numbers of part-time employees were the highest in the female dominated industries of wholesale and retail trade, and human health and social work activities. The share of part-time employees of all employees was the largest, or 38 per cent, in retail trade (excl. motor vehicle trade).
Figure 13. Part-time employees aged 15 to 74 by sex in 2000-2012
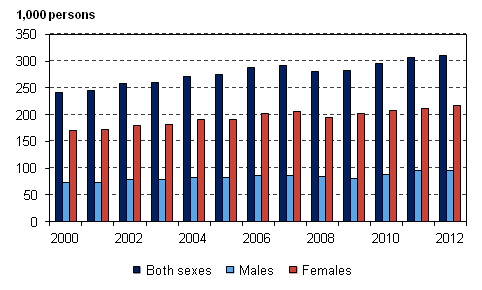
Figure 14. Share of part-time employees among employees aged 15 to 74 by sex in 2000-2012, %
Studying is still the commonest reason for working part-time
Working part-time suits the life situation of many of those who are employed part-time. By contrast, part-time employment can be viewed as one form of underemployment in cases where the employee has not succeeded in finding full-time work even if he/she would have wanted it.
In 2012, studying was again the commonest reason why employees worked part-time. Approximately 30 per cent of part-time employees quoted this reason. Working part-time is widespread among employees between the ages of 15 and 24 of whom 39 per cent worked part-time in 2012.
Other reported reasons related to life situation were caring for children or relatives, and health reasons. Nearly all of those who reported caring for children or relatives as the reason for working part-time were women. For one-quarter of part-time employees the reason for working part-time was that full-time work was not available. In 2012, employees working part-time involuntarily numbered 79,000, of whom 57,000 were women and 22,000 men.
Among the 55 to 64-year-old employees, the number of part-time workers was 64,000, which is 17 per cent of all employees in this age group.
2.6 Working hours in 2012
Working hours change slowly
The concepts of working hours used in statistics are usual weekly working hours, hours actually worked per week and hours actually worked per employed.
Usual weekly working hours refer to an employee's normal or average weekly working hours in the main job. Regular paid or unpaid overtime is included in the usual weekly working hours of employees. The average of usual weekly working hours is influenced by the form of working hours, i.e. whether full-time or part-time work is concerned.
Hours actually worked per week is the number of hours employed persons have worked in the survey week. Hours actually worked per week are separately inquired about in respect of the main job and secondary job. Paid or unpaid overtime hours are also included in it. On the other hand, holidays, weekdays off and absences for other reasons (e.g. sickness) reduce the hours actually worked per week.
Hours actually worked per employed is an imputed concept, which is obtained by dividing the number of hours worked by all employed during the year by the annual average number of employed. This produces the average hours actually worked per employed. The average hours actually worked per employed is calculated in the same way for employed employees.
Working hours and hours worked fluctuate according to changes in the employment and in the structure of the employee population. For instance, if part-time work becomes more widespread than full-time work, the average weekly working hours decrease. Working hours also vary by industry and occupation, as well as by employer sector. Working hours change quite slowly.
Commonest working week is 35 to 40 hours
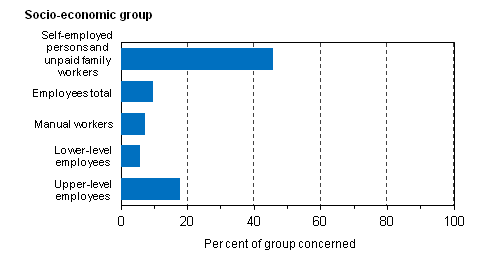
The vast majority (72%) of employees worked a regular week of 35 to 40 hours in 2012. Variations between different employee groups were fairly small. Only one in four of self-employed persons and unpaid family workers worked a regular week of 35 to 40 hours. (Figure 15.)
Figure 15. Share of persons working a regular week of 35 to 40 hours in the main job by socio-economic group in 2012, %

Approximately 18 per cent of employees had a short working week of under 35 hours. Around one in five of lower-level employees worked short hours. Short working weeks were less widespread among upper-level employees. Those with a regular short working week most typically worked 30 to 34 hours per week. Every fourth self-employed person and unpaid family worker did a short working week. (Figure 16.)
Figure 16. Share of persons working a short week of 1 to 34 hours in the main job by socio-economic group in 2012, %

Ten per cent of employees worked a long week of over 40 hours. Among all employees, upper-level employees most often worked regularly long hours. Around 18 per cent of them did long weekly working hours. Long usual weekly working hours were most widespread among self-employed persons and unpaid family workers, of whom 46 per cent regularly worked a long week of over 40 hours. (Figure 17.)
Figure 17. Share of persons with long usual weekly working hours of over 40 hours in the main job by socio-economic group in 2012, %
Men’s working week in full-time employment longer than women’s
In 2012, employees' average usual weekly working hours were 36.3 hours in their main job and their hours actually worked per week were 35.2 hours in their main job. The longest weekly hours were worked by self-employed persons (including unpaid family workers), whose average usual weekly working hours in 2012 totalled 42.1 and hours actually worked per week 41.5 hours. Hours actually worked per week are reduced by holidays and other absences and increased by worked overtime hours.
When examining employees' average usual weekly working hours in their main job, usual weekly working hours and hours actually worked per week in full-time employment were among men longer than among women in 2012 (Table 2).
Table 2. Average of employees’ usual weekly working hours and hours actually worked per week in the main job in full-time and part-time work in 2012
| Usual weekly working hours | Hours actually worked per week | |||
| Full-time work | Part-time work | Full-time work | Part-time work | |
| Both Sexes, total | 39.0 | 20.2 | 37.6 | 20.5 |
| Males | 39.9 | 18.9 | 38.7 | 19.7 |
| Females | 38.0 | 20.7 | 36.4 | 20.8 |
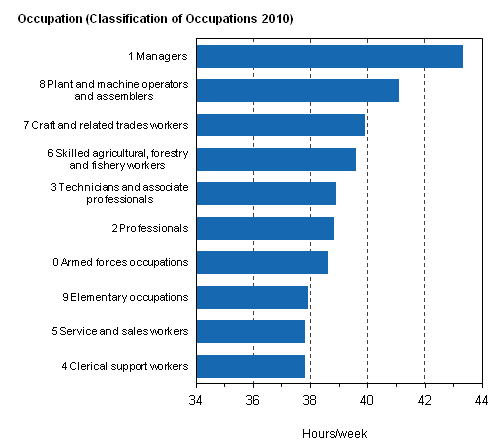
The average usual weekly working hours of managers in full-time work were around 43.3 hours (Figure 18). Apart from them, only plant and machine operators, and assemblers did a long working week of over 40 hours. The working week was shortest for clerical support workers, and for service and sales workers.
Figure 18. Average usual weekly working hours of full-time employees in the main job by occupation in 2012
Hours actually worked remained more or less unchanged in 2012
In the private sector and in central government, the hours actually worked per employed (see explanation of concept above) have been almost equal in recent years. In the local government sector, the hours actually worked per employed were clearly lower than in the other sectors, and in 2012 they went down somewhat while the hours remained unchanged in the private and central government sectors. (Figure 19.)
Figure 19. Employees' hours actually worked per employed by employer sector in 2005-2012

In 2012, the number of hours actually worked per employed was 226 hours lower among female employees than among male employees. For instance, women work more often part-time than men. Two-thirds of all employees working part-time are women. Family leaves also shorten women’s hours actually worked more than men’s.
Source: Labour force survey 2012. Statistics Finland
Inquiries: Joanna Viinikka 09 1734 3796, Pertti Taskinen 09 1734 2690, tyovoimatutkimus@stat.fi
Director in charge: Riitta Harala
Updated 5.11.2013
Official Statistics of Finland (OSF):
Labour force survey [e-publication].
ISSN=1798-7857. Time series data 2003-2012 2012,
2 Employment and unemployment in 2012
. Helsinki: Statistics Finland [referred: 19.2.2026].
Access method: http://stat.fi/til/tyti/2012/14/tyti_2012_14_2013-11-05_kat_002_en.html

