4 Number of persons in the inactive population grew in 2013
4.1 Retirement of the baby boom generations continued
In 2013, there were a total of 1,411,000 persons aged 15 to 74 in the inactive population. In the Labour Force Survey, the inactive population refers to persons who were not employed or unemployed during the survey week.
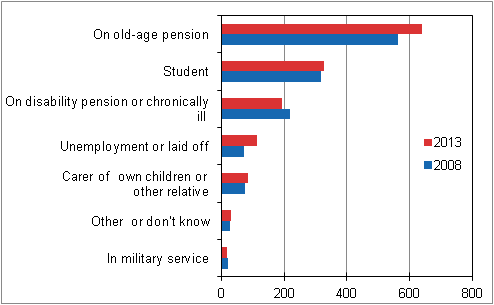
A majority of the inactive population, approximately 60 per cent, were on old-age or disability pension or otherwise chronically ill. Around one-quarter of the inactive population were full-time students or pupils. Approximately one-tenth of the inactive population reported that they were unemployed or laid off but did not meet the criteria of unemployment within the Labour Force Survey. Around six per cent were caring for their own children or some other relative. Data concerning main type of activity are based on the respondent's own reporting.
From 2008 to 2013, the number of persons in the inactive population has grown by a total of 110,000 persons. The number of persons on old-age pension increased by 77,000, which was affected by the retirement of the baby boom generations. The number of unemployed and laid off persons (respondent's own reporting) in the inactive population grew by 41,000 persons. The number of students, as well as persons caring for their own children or some other relative increased, but clearly less. By contrast, the number of persons on disability pension or otherwise chronically ill decreased. (Figure 20.)
Figure 20. persons in the inactive population aged 15 to 74 by main activity in 2008 and 2013

Data concerning main type of activity are based on the respondent's own reporting.
4.2 Number of persons in disguised unemployment grew further
Persons in the inactive population who would want gainful work and would be available for work within a fortnight, but who have not looked for work in the past four weeks are classified as persons in disguised unemployment in the Labour Force Survey. Persons in disguised unemployment can be considered as potential additional labour force.
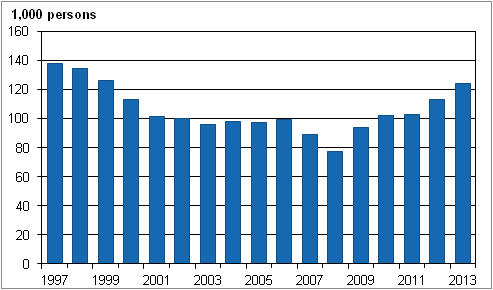
The number of persons in disguised employment was included in the statistics in 1997 when there were 138,000 persons aged between 15 and 74 in disguised unemployment. The number of persons in disguised unemployment was lowest at 77,000 in 2008 during a period of good employment, after which the number has slowly grown to 124,000 in 2013. (Figure 21.)
Figure 21. Persons in disguised unemployment in 1997–2013, persons aged 15 to 74

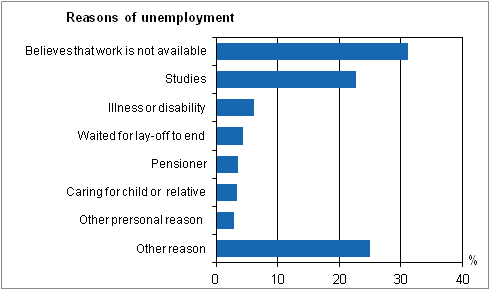
The assumption that no work is available (36,000) and studying (23,000) were the most common reasons reported by persons in disguised unemployment for why they had not sought for work even if they wanted a job (Figure 22). For example, persons who receive unemployment benefit, students and retired persons can give up active job seeking, i.e. withdraw from the labour market. In this case they are considered part of the inactive population in the Labour Force Survey.
Figure 22. Reasons reported by persons in disguised unemployment in 2013 for not actively seeking work even if they wanted a job, persons aged 15 to 74

In 2013, the numbers of persons in disguised unemployment were the highest in the 15 to 24 age group (37,000) and in the 55 to 64 age group (29,000). Among persons in disguised unemployment aged 15 to 24, the majority reported studying as the reason for not looking for work. Among persons aged 55 to 64, the most common reason was the assumption that no work was available. There were also persons in disguised unemployment among persons aged 65 to 74 (17,000). They named being retired as the most common reason for not seeking employment.
4.3 Young people not working, studying or performing compulsory military service
Because a majority of unemployed people aged 15 to 24 are students seeking part-time employment or summer jobs, in recent years we have, in addition to unemployment, also started monitoring the number of young people that are not working or studying and their share compared to the entire age group. This Section describes young people who are not employed and have not participated in any type of education in four weeks before the Survey and who are not performing compulsory military service either. Here, participation in education refers to both education leading to a qualification and participation in various types of courses.
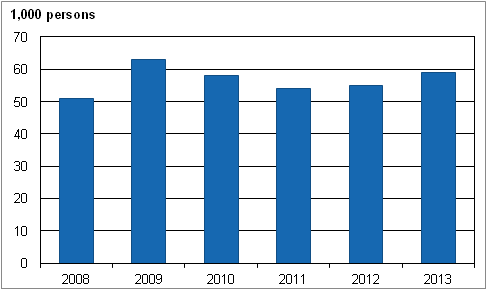
The number of young people aged 15 to 24 who are not working or studying has varied between 51,000 and 63,000 from 2008 to 2013 (Figure 23), and their share of all persons in the same age group has varied between eight to ten per cent. The shares of girls and boys have been close to one another. The changes in the numbers have reflected changes in the general employment situation. In 2008 to 2013, nearly three-quarters of these young people not working, studying or performing compulsory military service were aged 20 to 24. A majority of young people in this age group had completed secondary level education. 1)
Figure 23. Young people not working, studying or performing compulsory military service in 2008–2013

In 2013, there were a total of 59,000 young people not working, studying or performing compulsory military service, which represented nine per cent of the entire 15 to 24 age group. Of them, nearly two-thirds considered themselves unemployed. Almost one-sixth of young people that were not working or studying reported that they were on disability pension or otherwise chronically ill. Good one-tenth were caring for their children.
Young people that are not working, studying or performing compulsory military service consist of several different groups. Even though the clear majority considered themselves unemployed and the share of disabled persons was also high, the group as a whole does not, however, represent socially excluded persons or young people at risk of social exclusion. The number of young people that are not working, studying or performing compulsory military service have been highest during summer and at the turn of the year, which partially suggests that for many this is a short period during which they prepare for entrance examinations, take a holiday, or wait in between studies, work or compulsory military service.
1) Eurostats uses the term NEET (Not in Employment, Education or Training) for these types of young people, as well as the term NEET rate. The term is explained in http://tilastokeskus.fi/meta/kas/ei_tyossa__koul_en.html.
Source: Labour Force Survey 2013. Statistics Finland
Inquiries: Heidi Melasniemi-Uutela 09 1734 2523, Joanna Viinikka 09 1734 3796, tyovoimatutkimus@stat.fi
Director in charge: Riitta Harala
Updated 1.4.2014
Official Statistics of Finland (OSF):
Labour force survey [e-publication].
ISSN=1798-7857. Employment and unemployment 2013,
4 Number of persons in the inactive population grew in 2013
. Helsinki: Statistics Finland [referred: 10.2.2026].
Access method: http://stat.fi/til/tyti/2013/13/tyti_2013_13_2014-04-01_kat_004_en.html

