2 Employment and unemployment in 2016
2.1 Men's employment improved in 2016
Number of employed men grew from the previous year
According to Statistics Finland's Labour Force Survey, the employment rate for the population aged 15 to 64 was 68.7 per cent in 2016. The employment rate grew by 0.6 percentage points from 2015. The growth was mainly due to the employment rate of men, which rose by over one percentage point from 68.5 to 69.8 per cent in 2016. Women’s employment rate was almost unchanged, at 67.6 per cent in 2016. (Figure 1.)
Figure 1. Employment rates by sex in 1992 to 2016 persons aged 15 to 64, %
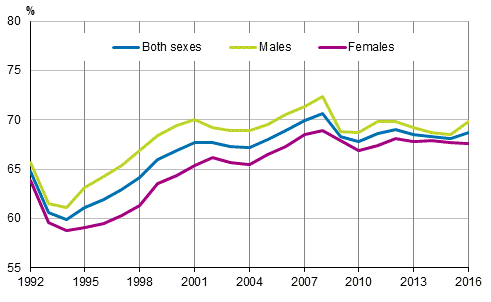
The employment rate of women aged 15 to 64 is considerably higher in Finland than the corresponding average for EU28 countries . Men’s employment rate is slightly below the EU28 average. In 2015, the average employment rate of women in the EU28 countries was 60.4 per cent and 70.8 per cent for men. In Finland, men’s and women's employment rates are exceptionally close to each other.
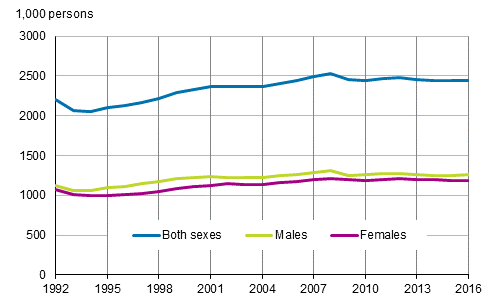
In 2016, the number of employed persons aged 15 to 74 in Finland was 2,448,000, which was 11,000 higher than in 2015 (Figure 2). The number of employed persons increased in all quarters compared to the corresponding quarters of the previous year. The growth was biggest in the second and fourth quarters.
Figure 2. Number of employed persons by sex in 1992 to 2016, persons aged 15 to 74
Number of employed men grew, that of women fell
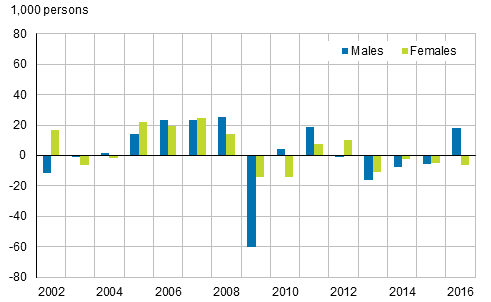
Men's employment made an upturn in 2016 for the first time since 2011. In turn, women's employment weakened for the fourth year in a row. The number of employed men grew by 18,000, but the group of employed women declined by 6,000 persons from 2015 to 2016. Figure 3 shows the change in the number of employed persons as a time series by sex.
Figure 3. Change from the previous year in the number of employed persons by sex in 2002 to 2016, persons aged 15 to 74
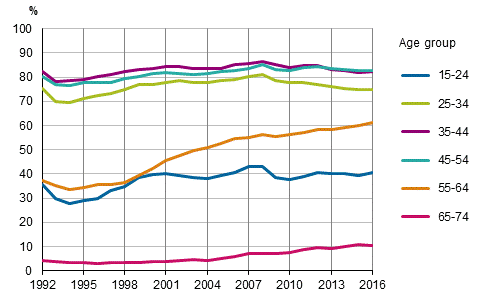
There are clear differences in the development of the employment rate by age group in the long term (Figure 4). The biggest change has taken place in the employment rate of the 55 to 64 age group, which has risen by 26 percentage points during the past 20 years. In addition, the employment rate of the oldest age group, those aged 65 to 74, has tripled in 20 years, being 10.6 per cent in 2016.
The number of employed persons decreased slightly in 2016 in the 65 to 74 age group, and in the 45 to 54 age group the number of employed persons remained unchanged from 2015. In all other age groups the number of employed persons grew from 2015. (Figure 4.)
The number of employed persons increased in 2016 most in the groups of men aged 15 to 24 and 55 to 64; in the group of young employed men the number grew by 6,000 and the number of employed men aged 55 to 64 went up by 7,000 persons. The employment rate increased in these groups by over two percentage points from 2015. Despite this, the employment rates of both men aged 15 to 24 (37.9%) and 55 to 64 (59.8%) were still clearly lower than the employment rates of women (43.2% and 63.0%) in the corresponding age groups in 2016.
Figure 4. Employment rates by age group in 1992 to 2016, %
Number of employed persons grew in the industries of construction, trade and human health and social work activities
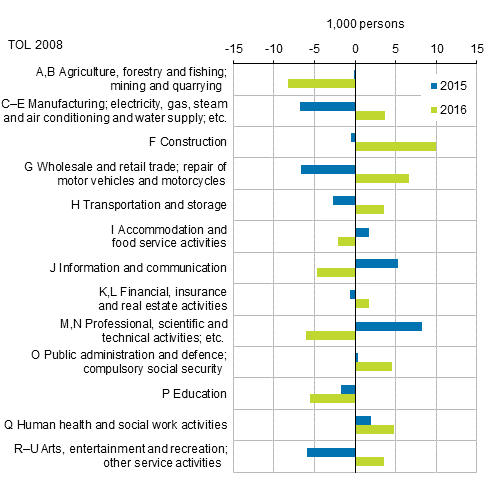
In 2016, the number of employed persons increased particularly in the industry of construction (F), which grew by 10,000 people. Employment in wholesale and retail trade (G) increased by 6,000 persons, growing mostly in wholesale trade. The number of employed persons increased by a total of 5,000 persons in human health and social work activities (Q), where growth concerned solely employed persons in social work activities. The number of employed persons in public administration and defence and compulsory social security (O) increased by 5,000 persons.
In contrast, the number of employed persons in agriculture, forestry and fishing, and mining and quarrying (A,B) went down by 8,000 persons, in business activities (M,N) by 6,000 persons, in education (P) by 6,000 and in information and communication activities (J) by 5,000. PX-Web Statfin table 030 .
Figure 5 shows the change from the previous year in the number of employed persons by industry in 2015 and 2016.
Figure 5. Change from the previous year in the number of employed persons by industry in 2015 and 2016, persons aged 15 to 74
Employment increased in the private sector by 24,000 persons, but decreased in the public sector by 11,000 persons in 2016.
There were 2,105,000 employees in 2016, which was 15,000 more than in the previous year. In contrast, the number of self-employed persons and unpaid family workers fell slightly. In 2016, the total number of self-employed persons and unpaid family workers was 344,000, of whom 13,000 were unpaid family workers. The share of self-employed persons and unpaid family workers among the employed was 14 per cent in 2016, the same as one year earlier.
Examined by socio-economic group, the growth in employment concerned lower-level employee occupations. The number of lower-level employees grew by 12,000, while the number of upper-level employees and manual workers remained unchanged. The number of male lower-level employees grew by 8,000 persons, and that of women by 4,000 persons. The number of men in manual worker occupations also grew clearly, by 10,000, while the number of female manual workers decreased by 9,000. The number of women and men working as upper-level employees did not change much compared with 2015.
The socio-economic structure of male and female employees is very different. Over one-half of female employees worked as lower-level employees, close on one-fifth in manual worker occupations and good one-quarter as upper-level employees in 2016. Manual worker occupations were most common for men, as 44 per cent of male employees worked in them in 2016. Every fourth male employee worked as a lower-level employee and nearly one-third as an upper-level employee.
Number of hours worked grew
In 2016, a total of four billion hours were worked in the whole national economy. The number of hours worked by employed persons grew by 65,000 hours compared to 2015. In 2016, the average annual number of hours worked by an employed was 1,639 hours, whereas in 2015 the respective figure was 1,620 hours.
In 2016, the number of underemployed persons was 145,000, which was 8,000 more than in 2015. The number of underemployed women has grown in particular. Underemployed persons refer to persons working involuntarily part-time or a shortened working week or that have not had work due to a low number of orders or customers or due to being temporarily laid off.
2.2 Number of unemployed decreased in 2016
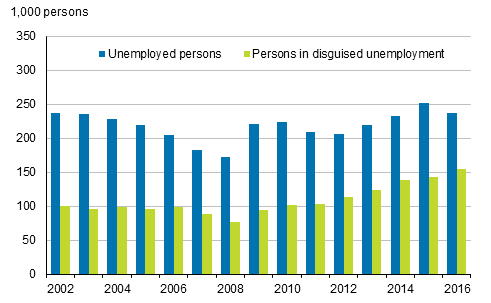
Unemployment decreased in 2016. In 2016, the average number of unemployed was 237,000, which was 15,000 fewer than in the year before. The number of unemployed men was 126,000 and that of women 111,000. The number of unemployed men fell by 11,000 persons, and that of unemployed women by 4,000 persons.
The unemployment rate among persons aged 15 to 74 was, on average, 8.8 per cent in 2016, having been 9.4 per cent in 2015. Men’s unemployment rate was 9.0 per cent and women’s 8.6 per cent.
Besides unemployed persons, there were 155,000 persons aged 15 to 74 classified as being in disguised unemployment, who would and could have accepted work, but had not looked for it actively. Although the number of unemployed persons declined, the number of persons in disguised unemployment grew by 11,000 from 2015. Figure 6 shows the change in the number of the unemployed and persons in disguised unemployment as a time series. The total number of unemployed persons and persons in disguised unemployment was 392,000 in 2016, which was somewhat lower than one year before. More about persons in disguised unemployment in Section 4 Inactive population.
Figure 6. Unemployed persons and persons in disguised unemployment in 2002 to 2016, persons aged 15 to 74
In 2016, the unemployment rate for young people aged 15 to 24, that is, the proportion of the unemployed among the labour force, stood at 20.1 per cent, which was 2.3 percentage points lower than one year previously. In the other age groups, the unemployment rates fell less than this or remained unchanged (Figure 7). The relative share of young people in all unemployed persons fell slightly. In the 15 to 24 age group, 65,000 persons were unemployed in 2016, which was 27 per cent of all unemployed persons. In 2015, the corresponding figure was 73,000, or 29 per cent of all unemployed persons. Young men's unemployment fell particularly. In 2016, there were 5,000 fewer unemployed young men than in the year before.
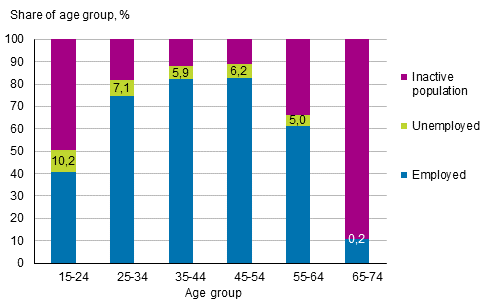
The share of unemployed people aged 15 to 24 among the population in the same age group was 10.2 per cent in 2016 (Figure 8). The share diminished by one percentage point from 2015.
Figure 7. Unemployment rates by age group in 1992 to 2016, %
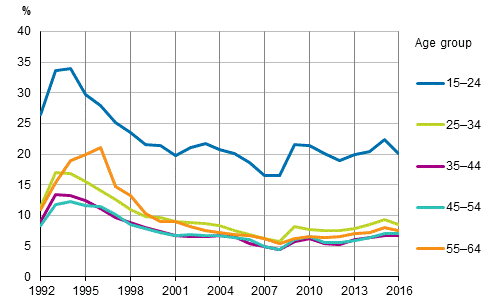
Figure 8. Shares of employed and unemployed persons, and inactive population of age group in 2016, %
2.3 Growth in the labour force halted
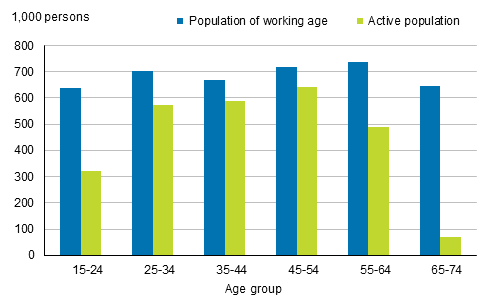
In 2016, the Finnish population included 4,109,000 persons aged 15 to 74. The number of working-age people (aged 15 to 74) grew by 7,000 persons from 2015. Simultaneously, the number of persons aged 15 to 64 decreased, however, as the growth mostly concerned the age group of those aged 65 to 74, which grew by 20,000 persons from the year before. The 55 to 64 age group diminished by 5,000 persons but still remained the largest age group among people of working age (Figure 9).
The share of the active population, i.e. employed and unemployed persons aged 15 to 74, decreased slightly from 65.6 per cent in the previous year to 65.3 per cent in 2016. The size of the active population shrunk by 4,000 persons.
In 2016, the number of persons in the inactive population aged 15 to 74 was 1,424,000, which was 11,000 persons more than in 2015. More about the inactive population in Section 4.
Figure 9. Population of working age and active population by age group in 2016
2.4 Number of employees’ new employment contracts of under one year's duration increased in 2016
Temporary employment is more widespread among women than men
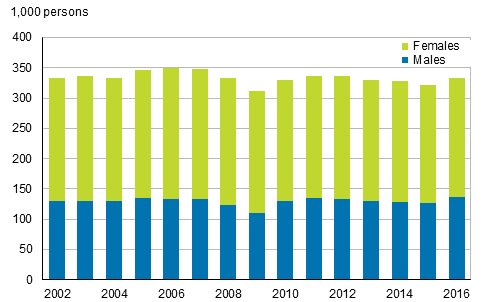
In 2016, the average number of employees in Finland was 2,105,000, which was 15,000 higher than in 2015. In all, 333,000 employees had temporary employment contracts, 197,000 of whom were women and 136,000 men (Figure 10). The number of temporary employees grew by 11,000 from the year before. The number of men working as temporary employees grew by 8,000 persons.
Figure 10. Number of temporary employees aged 15 to 74 by sex in 2002 to 2016
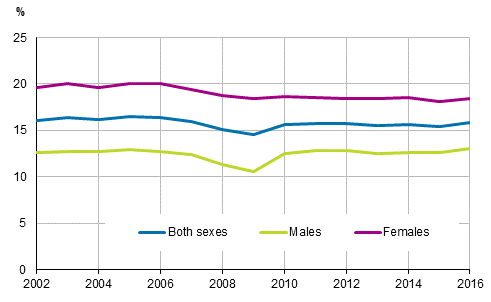
Eighty-four per cent of all employment contracts of employees were permanent and 16 per cent temporary in 2016. The relative share of temporary employees has remained at the same level throughout the 2010s. Temporary employment relationships are more common for women than for men. In 2016, eighteen per cent of female employees and around 13 per cent of male employees worked in a temporary employment relationship. The share of temporary female employees has stayed almost unchanged over the 2010s. For men, the share of temporary employees was in 2016 still higher than in 2008 and 2009. (Figure 11.)
Figure 11. Share of temporary employees of all employees aged 15 to 74 by sex in 2002 to 2016, %
Two out of three temporary employees would want a permanent job
Temporary employment may be suitable for the life situation of the employee, a desired option or be caused by that there is no permanent job available. Approximately 25 per cent of temporary employees did not want a permanent job in 2016. The majority of them (71%) were aged either under 25 or over 55. Summer workers are a typical group of persons working voluntarily in temporary jobs. The oldest temporary employees include many working pensioners.
Forty-three per cent of temporary young employees aged 15 to 24 did not want a permanent job. In contrast, around every tenth person aged 35 to 54 would not have wanted to have a permanent job.
However, a more common reason for working in a temporary employment relationship is that permanent work cannot be found. In 2016, lack of permanent work was the reason why 68 per cent of temporary employees worked in temporary jobs. This was more widespread among women than men. The share of persons working involuntarily in temporary jobs among all temporary employees remained unchanged compared to 2015. Lack of permanent work was most common in age groups of temporary employees aged 35 to 54. Of them, 84 per cent named that as the reason for having a temporary job.
In 2016, there were 226,000 temporary employees on the labour market who had not found a permanent job even though they would have wanted one. Of them, 139,000 were women and 86,000 men. Other reasons for temporary employment were trial period and practical training connected to studies.
Over one-half of new employment contracts were temporary
In 2016, there were 432,000 employees whose employment relationship had lasted less than a year, which was 36,000 more than in 2015. (Figure 12.)
Figure 12. Employees with employment contracts of under one year's duration in 2002 to 2016, persons aged 15 to 74
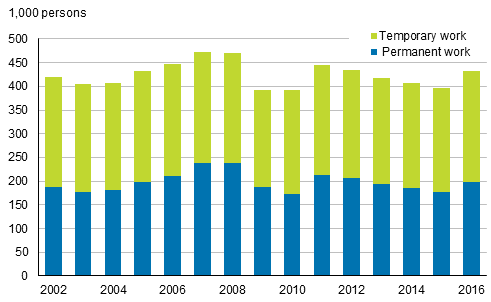
Fifty-four per cent of the employment contracts of under one year's duration were temporary. The share has fallen somewhat, because the corresponding share in 2015 was 56 per cent. There has been a clear difference between women and men in whether a new employment relationship is temporary or permanent. Forty-eight per cent of men’s and 60 per cent of women’s new employment relationships were temporary in 2016. New temporary employment contracts of female employees have been made slightly less often than before, because 62 per cent of new employment contracts of female employees were temporary in 2015.
Nearly two per cent of employees did temporary agency work
Temporary agency work refers to an employment relationship in which an employee works via an enterprise which provides or hires out labour force. Data on temporary agency work have been collected in the Labour Force Survey since 2008. Data on temporary agency work describe the situation in an "average" week of the survey year. In 2016, the average number of persons doing temporary agency work was 38,000, which was 7,000 more than in 2015. Temporary agency work has become more widespread especially among men. There were 22,000 men in temporary agency work in 2016, which was 7,000 more than in the previous year. The number of women in temporary agency work remained unchanged at 16,000 persons.
Among all employees, the share of temporary agency workers was nearly two per cent in 2016. Thus, doing temporary agency work is still quite a marginal form of working on the Finnish labour market.
Temporary agency workers are employed by several industries. Temporary agency work is most common in wholesale and retail trade (G), manufacturing (C to E) and accommodation and food service activities (I). In all these industries temporary agency work had also become more widespread compared with 2015.
2.5 Number of women working part-time grew clearly
Number of part-time employees highest in female-dominated industries
In 2016, altogether 399,000 persons or 16 per cent of all employed persons worked part-time. This was 21,000 more than in 2015. In 2016, the number of part-time working employees was 321,000, which was 15,000 more than in the year before. The Labour Force Survey data on part-time employment is based on the respondents’ own reporting. The following only concerns part-time employees.
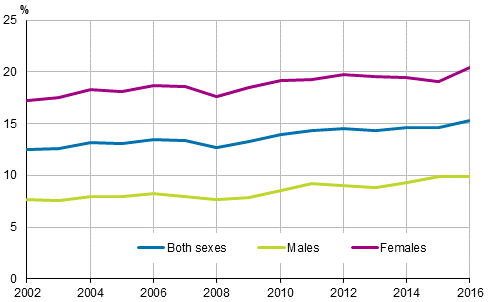
Part-time employment is more widespread among women than men. In 2016, twenty per cent of female employees worked part-time, or 219,000 persons and 10 per cent of male employees, i.e. 103,000 persons. The share of male employees working part-time remained the same as in 2015, for women, the share of part-time employees in turn grew by one percentage point, i.e. 14,000 persons. (Figures 13 and 14.)
Working part-time is widespread especially among employees between the ages of 15 and 24, of whom 42 per cent worked part-time in 2016 primarily due to studies. In the oldest age group of those aged 65 to 74 part-time work was also common: it was done by 62 per cent of employees. Women working part-time increased especially in the 35 to 44 age group, where the number of part-time female employees grew by 6,000 persons or by a couple of percentage points in 2016. In this women's age group 16 per cent of employees worked part-time in 2016.
Approximately three-quarters (76%) of part-time employees worked in the private sector. The numbers of part-time employees were the highest in the industries of wholesale and retail trade (G), and human health and social work activities (Q). The share of part-time employees of all employees in the industry was the largest, or 39 per cent, in retail trade (excl. motor vehicle trade).
Figure 13. Part-time employees by sex in 2002 to 2016, persons aged 15 to 74
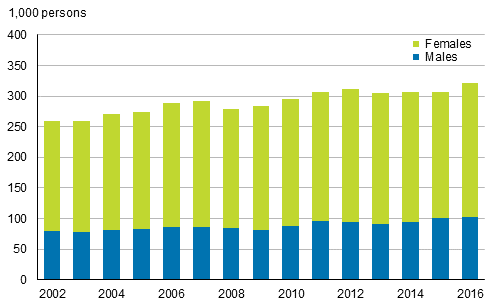
Figure 14. Share of part-time employees among employees by sex in 2002 to 2016, persons aged 15 to 74, %
Lack of full-time work the most common reason for part-time employment
Working part-time suits the life situation of many of those who are employed part-time. However, part-time employment can be viewed as one form of underemployment in cases where the employee has not succeeded in finding full-time work even if he/she had wanted one.
In 2016, lack of full-time employment was the most common reason for working part-time. This reason was given by one-third of part-time workers, as in 2015. In previous years, the most common reason for working part-time has been studying. In 2016, employees working part-time involuntarily numbered 106,000, of whom 73,000 were women and 33,000 men.
Other reported reasons related to life situation were caring for children or relatives, and health reasons. Nearly all of those who reported caring for children or relatives as the reason for working part-time were women. For nearly three in ten part-time employees, the reason for working part-time was studying.
2.6 Different forms of working among the employed
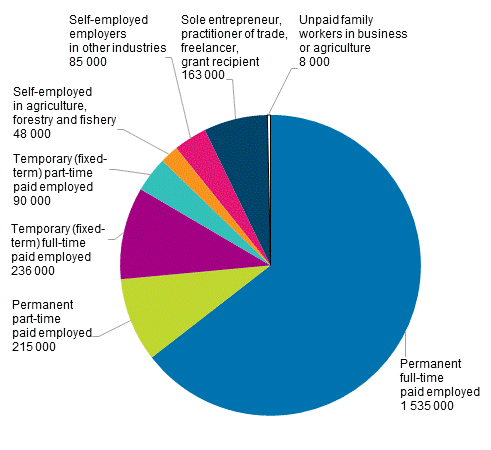
In Figure 15, the forms of working among the employed have been classified as precisely as can be published based on the data of the Labour Force Survey. The figure shows that full-time paid work based on an employment contract valid until further notice, that is, permanent, was still in 2016 by far the most common form of working in Finland among those aged 15 to 64. Sixty-five per cent of employed persons aged 15 to 64 worked in a permanent full-time employment relationship in 2016. Of them, 711,000 were women and 825,000 were men. The number of women in permanent full-time paid work went down by 18,000 persons and that of men grew by 13,000 per cent from the year before.
Every tenth employed person was an employee on a full-time temporary employment contract. Four per cent of employed persons did part-time work on a temporary employment contract. Their number grew by 8,000 from the previous year. Nearly every tenth employed person was a part-time employee on an employment contract valid until further notice. Their number also grew by 8,000 persons.
The share of persons working as sole entrepreneurs, own-account workers, freelancers and grant recipients (excl. agriculture and forestry) among all employed persons aged 15 to 64 was seven per cent in 2016. This corresponds to 163,000 persons, of whom 100,000 were men and 63,000 women. The size of the group grew by 5,000 compared with 2015. Of all employed persons aged 15 to 64, 3.6 per cent were employer entrepreneurs (excl. agriculture and forestry), and two per cent were farmers and forestry entrepreneurs. The number of farmers and forestry entrepreneurs has long been falling. From 2015, their number diminished by 7,000 persons.
Table 1. Different forms of working among persons aged 15 to 64 by sex in 2016, %
| Males | Females | |
| Permanent full-time paid work | 67 | 62 |
| Permanent part-time paid work | 5 | 13 |
| Temporary full-time paid work | 8 | 12 |
| Temporary part-time paid work | 3 | 5 |
| Farmer and forestry entrepreneur | 3 | 1 |
| Employer entrepreneur | 5 | 2 |
| Sole entrepreneur, own-account worker, freelancer, grant recipient | 8 | 5 |
| Unpaid family worker in an enterprise / farm | . | . |
Figure 15. Different forms of working among employed persons aged 15 to 64 in 2016
Source: Labour Force Survey 2016. Statistics Finland
Inquiries: Hanna Sutela 029 551 2907, Liisa Larja 029 551 3461, tyovoimatutkimus@stat.fi
Director in charge: Jari Tarkoma
Updated 12.4.2017
Official Statistics of Finland (OSF):
Labour force survey [e-publication].
ISSN=1798-7857. Time series data 2007-2016 2016,
2 Employment and unemployment in 2016
. Helsinki: Statistics Finland [referred: 20.2.2026].
Access method: http://stat.fi/til/tyti/2016/13/tyti_2016_13_2017-04-12_kat_002_en.html

