Published: 4 March 2021
Employment turned to a decline in 2020
Employment weakened especially among young people and women
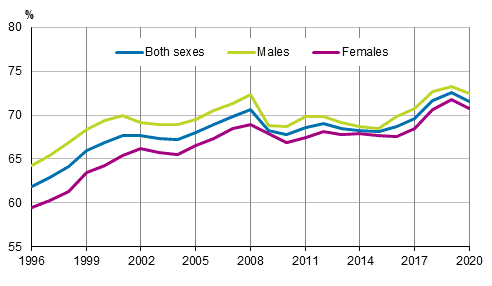
According to the Labour Force Survey, the employment rate for the population aged 15 to 64 was 71.6 per cent in 2020. The employment rate fell by one percentage point from 2019. The employment rate for men decreased by 0.8 percentage points to 72.5 per cent, that of women by 1.1 percentage points to 70.7 per cent. (Figure 1.)
In 2020, the average number of employed persons aged 15 to 74 was 2,528,000, which is 37,000 fewer than in 2019. There were 12,000 fewer employed men and 25,000 fewer employed women than in the year before.
According to the established practice, the employment rate is reported in the Labour Force Survey as a percentage of the population aged 15 to 64. The other data of the annual publication of the Labour Force Survey concern the population aged 15 to 74, unless otherwise indicated.
Figure 1 Employment rates by sex in 1996 to 2020, persons aged 15 to 64, per cent

The employment rate of persons aged 15 to 74 was 61.2 per cent and among persons aged 20 to 69 it was 69.9 per cent in 2020. Employment rates with age group divisions are available in the Labour Force Survey's database table Population by labour force status, sex and age .
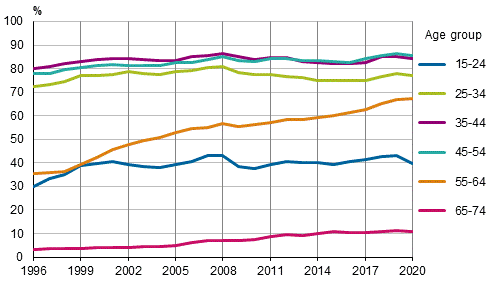
In 2020, the employment rate fell in nearly all age groups compared with the previous year, most among those aged 15 to 24 (Figure 2). The employment rate was highest (85.7%) in the 45 to 54 age group. Men's employment rate rose in the age groups 55 to 64 (by 1.8 percentage points) and 65 to 74 (by 0.5 percentage points) compared with 2019. Women's employment rate fell in all age groups.
Figure 2 Employment rates by age group in 1996 to 2020, per cent

Part-time work decreased for women, full-time work decreased for men
In 2020, the number of employees in full-time work was 1,861,000, which is almost the same as in the year before. The number of employees in part-time work was 327,000, which is 29,000 fewer than in 2019. There were 12,000 fewer men and 9,000 more women in full-time work than in the year before. In 2020, twenty per cent of female employees worked part-time, or 218,000 persons, and 10 per cent of male employees, or 110,000 persons. For men, the share of persons working part-time of all employees remained almost the same as in 2019. For women, the share working part-time of all employees fell by two percentage points. The share of employees working part-time was highest in accommodation and food service activities (I), 40 per cent.
Number of employed persons decreased in accommodation and food service activities and increased in professional, scientific and technical activities
Examined by main industry, the number of employed persons decreased most in accommodation and food service activities (I), by 19,000 employed, in wholesale and retail trade (G), by 17,000 employed, and in human health and social work activities (Q), by 11,000 employed. Compared with the previous year, the number of employed persons also decreased in transportation and storage (H), by 9,000 employed, in agriculture, forestry and fishing, and mining and quarrying (A, B), by 6,000 employed, and in administrative and support service activities (N), also by 6,000 employed. The number of employed persons also fell in construction (F) and other service activities (R–U).
The number of employed persons increased in professional, scientific and technical activities (M) by 19,000 employed persons compared with 2019. Compared with the previous year, there were 8,000 more employed persons in public administration and defence and compulsory social security (O). Information and communication (J) grew by 7,000 employed persons. The number of employed persons also increased in electricity, gas, steam, air conditioning and water supply and sewerage (D to E) and in financial and insurance activities, real estate activities (K, L) and education (P).
Number of persons unemployed, in disguised unemployment and laid-off made an upturn
In 2020, the average number of unemployed persons was 213,000, which is 29,000 more than in 2019. The number of unemployed men was 114,000 and that of women 98,000. There were 12,000 more unemployed men and 17,000 more unemployed women compared to the previous year.
The unemployment rate among persons aged 15 to 74 was, on average, 7.8 per cent in 2020, having been 6.7 per cent in 2019. The unemployment rate for men grew to 8.0 per cent and that of women to 7.5 per cent.
In 2020, the average number of laid-off persons was 49,000, which was 41,000 higher than in 2019. The number of laid-off men was 26,000 and that of women 23,000.
There were 138,000 persons in disguised unemployment, which is 24,000 more than in 2019. Of them, 13,000 were women and 11,000 were men. The number of persons in disguised unemployment made an upturn in 2020, while it had fallen in the three previous years. Persons in disguised unemployment refer to persons who would want work and would be available for work but who have not looked for work in the past four weeks.
Unemployment grew sharpest among young people
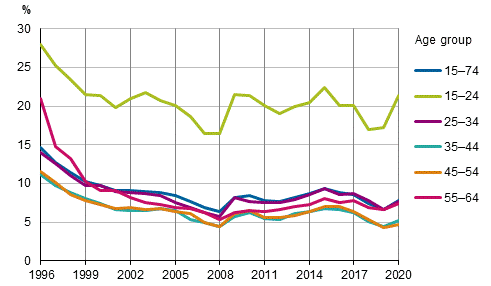
In 2020, the unemployment rate rose in all ten-year age groups of persons aged under 65, most in the 15 to 24 age group (Figure 3). The unemployment rate for people in this age group, that is, the share of the unemployed among the labour force, stood at 21.4 per cent, which is 4.2 percentage points higher than one year previously. In all, 66,000 young people aged 15 to 24 were unemployed in 2020, which is 31 per cent of all unemployed persons.
The share of unemployed persons aged 15 to 24 in the population of the same age was 10.8 per cent in 2020, having been 9.0 per cent in 2019.
Figure 3 Unemployment rates by age group in 1996 to 2020, per cent

Active population decreased, number of persons in the inactive population grew
In 2020, the working-age population or those aged 15 to 74 was 4,133,000, which is 5,000 more than in 2019. The number of persons aged 15 to 74 in the active population, i.e. the employed and unemployed, decreased by 9,000 from 2019. The share of persons aged 15 to 74 in the active population was 66.3 per cent in 2020, the share remained almost unchanged from the previous year.
In 2020, the number of persons aged 15 to 74 in the inactive population was 1,392,000, which is 14,000 more than in 2019. There were 10,000 more women and 4,000 more men in the inactive population. In the 55 to 64 age group, the number of persons in the active population grew by 9,000 and that of the inactive population decreased by 12,000 persons.
Due to the renewal of the Labour Force Survey, the annual publication is less extensive than usual. More about the renewal here: How and why is the Labour Force Survey renewed? and here (in Finnish): Työvoimatutkimuksen uudistus.
Links
Labour Force Survey tables in databases
Source: Labour Force Survey 2020. Statistics Finland
Inquiries: Ulla Hannula 029 551 2924, Tatu Leskinen 029 551 3285, tyovoimatutkimus@stat.fi
Head of Department in charge: Hannele Orjala
Publication in pdf-format (966.6 kB)
- Reviews
-
- 1 Labour Force Survey data content in 2008 to 2020 (4.3.2021)
- 2 Concepts and definitions used in the Finnish Labour Force Survey (4.3.2021)
- 3 Classifications (4.3.2021)
- 4 Notes to the appendix tables (4.3.2021)
- Tables
-
Tables in databases
Pick the data you need into tables, view the data as graphs, or download the data for your use.
Appendix tables
- Appendix table 1. Population aged 15-74 by labour force status and sex in 2011 - 2020 (4.3.2021)
- Appendix table 2. Active population by age and sex in 2011 - 2020 (4.3.2021)
- Appendix table 3. Activity rates by age and sex in 2011 - 2020 (4.3.2021)
- Appendix table 4. Inactive population by age and sex in 2011 - 2020 (4.3.2021)
- Appendix table 5. Employed persons by age and sex in 2011 - 2020 (4.3.2021)
- Appendix table 6. Employment rates by age and sex in 2011 - 2020 (4.3.2021)
- Appendix table 7. Employed persons aged 15-64 and employment rates by Regional State Administrative Agencies (AVI) in 2016 - 2020 (4.3.2021)
- Appendix table 8. Employed persons aged 15-74 by socio-economic group and sex in 2011 - 2020 (4.3.2021)
- Appendix table 9. Employed persons aged 15-74 by educational level and sex in 2011 - 2020 (4.3.2021)
- Appendix table 10. Employed persons aged 15-74 by industry (TOL 2008) and sex in 2016 - 2020 (4.3.2021)
- Appendix table 11. Employees and self-employed persons aged 15-74 by industry (TOL 2008) in 2016 - 2020 (4.3.2021)
- Appendix table 12. Employed persons aged 15-74 by employer sector and industry (TOL 2008) in 2016 - 2020 (4.3.2021)
- Appendix table 13. Employees aged 15-74 by employer sector and sex in 2011 - 2020 (4.3.2021)
- Appendix table 14. Part-time employed persons by age and sex in 2011 - 2020 (4.3.2021)
- Appendix table 15. Part-time employed persons aged 15-74 by industry (TOL 2008) in 2016 - 2020 (4.3.2021)
- Appendix table 16. Employees aged 15-74 by type of employment relationship and sex in 2011 - 2020 (4.3.2021)
- Appendix table 17. Employees aged 15-74 by type of employment relationship and sex in 2011 - 2020, % (4.3.2021)
- Appendix table 18. Hours actually worked, including hours worked at secondary jobs, of employed persons aged 15-74 by industry (TOL 2008) in 2016 - 2020 (4.3.2021)
- Appendix table 19. Hours actually worked, including hours worked at secondary jobs, of employees aged 15-74 by industry (TOL 2008) in 2016 - 2020 (4.3.2021)
- Appendix table 20. Annual hours actually worked per employed by employer sector and industry (TOL 2008) in 2016 - 2020 (4.3.2021)
- Appendix table 21. Annual hours actually worked per employee by employer sector and industry (TOL 2008) in 2016 - 2020 (4.3.2021)
- Appendix table 22. Unemployed persons by age and sex in 2011 - 2020 (4.3.2021)
- Appendix table 23. Unemployment rates by age and sex in 2011 - 2020 (4.3.2021)
- Appendix table 24. Unemployed persons aged 15-74 and unemployment rates by Regional State Administrative Agencies (AVI) in 2016 - 2020 (4.3.2021)
- Appendix table 25. Unemployment rates by educational level and sex in 2011 - 2020, persons aged 15-74 (4.3.2021)
- Appendix table 26. Population aged 15-74 by labour force status, age and sex in 2020 (4.3.2021)
- Appendix table 27. Population aged 15-74 by labour force status, age and sex in 2020, % (4.3.2021)
- Appendix table 28. Population aged 15-64 by labour force status and region in 2020 (4.3.2021)
- Appendix table 29. Employed persons aged 15-74 by status in employment, age and sex in 2020 (4.3.2021)
- Appendix table 30. Employed persons aged 15-74 by industry (TOL 2008) and sex in 2020 (4.3.2021)
- Appendix table 31. Employed persons aged 15-64 by industry (TOL 2008) and age in 2020 (4.3.2021)
- Appendix table 32. Employed persons aged 15-74 by employer sector and industry (TOL 2008) in 2020 (4.3.2021)
- Appendix table 33. Employed persons aged 15-74 by industry (TOL 2008) and Regional State Administrative Agencies (AVI) in 2020 (4.3.2021)
- Appendix table 34. Employed persons aged 15-74 by occupation (Occupational Classification 2010) and sex in 2020 (4.3.2021)
- Appendix table 35. Employees aged 15-74 by socio-economic group and sex in 2020 (4.3.2021)
- Appendix table 36. Employed persons aged 15-74 having worked at secondary jobs during the survey week by industry (TOL 2008) of main job in 2020 (4.3.2021)
- Appendix table 37. Employees aged 15-74 having paid overtime during the survey week and the proportion of them of all employees by industry (TOL 2008) in 2020 (4.3.2021)
- Appendix table 38. Employees aged 15-74 in permanent and temporary (fixed-term) work by industry (TOL 2008) in 2020 (4.3.2021)
- Appendix table 39. Employees aged 15-74 in permanent and temporary (fixed-term) work by employer sector and sex in 2020 (4.3.2021)
- Appendix table 40. Employees aged 15-74 in temporary (fixed-term) work by reason for temporary work and sex in 2020, % (4.3.2021)
- Appendix table 41. Full-time and part-time employees aged 15-74 by industry (TOL 2008) in 2020 (4.3.2021)
- Appendix table 42. Full-time and part-time employees aged 15-74 by employer sector and sex in 2020 (4.3.2021)
- Appendix table 43. Employees aged 15-74 by type of employment relationship, age and sex in 2020 (4.3.2021)
- Appendix table 44. Different types of employment relationships of employees whose present work has continued less than 12 months by age and sex in 2020, persons aged 15-64, % (4.3.2021)
- Appendix table 45. Employed persons aged 15-74 by usual weekly working hours in main job and industry (TOL 2008) in 2020 (4.3.2021)
- Appendix table 46. Employees aged 15-74 by usual weekly working hours in main job and industry (TOL 2008) in 2020 (4.3.2021)
- Appendix table 47. Average usual weekly working hours in main job of employed persons aged 15-74 in full-time and part-time work by socio-economic group and sex in 2020 (4.3.2021)
- Appendix table 48. Average usual weekly working hours in main job of employees aged 15-74 by socio-economic group and employer sector in 2020 (4.3.2021)
- Quality descriptions
-
- Quality Description: Labour force survey (4.3.2021)
Updated 4.3.2021
Official Statistics of Finland (OSF):
Labour force survey [e-publication].
ISSN=1798-7857. Employment and unemployment 2020. Helsinki: Statistics Finland [referred: 15.2.2026].
Access method: http://stat.fi/til/tyti/2020/13/tyti_2020_13_2021-03-04_tie_001_en.html

