Published: 22 October 2013
Finland's preliminary population figure 5,445,883 at the end of September
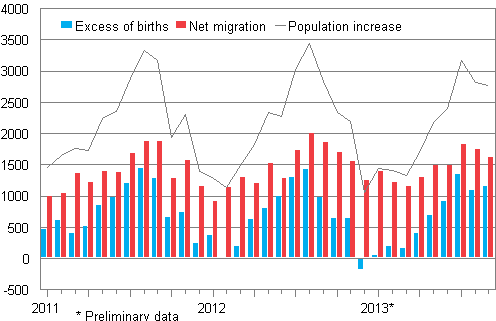
According to Statistics Finland's preliminary data, Finland's population at the end of September was 5,445,883. Over the January to September period, Finland's population increased by 19,210 persons, which is 430 less than in the respective period of one year previously. The main reason for the population increase was migration gain from abroad: the number of immigrants was 13,220 higher than that of emigrants. Natural population growth, or excess of births to deaths, was 5,990 persons.
Population increase by month 2011–2013*

According to the preliminary statistics for January to September period, 23,500 persons immigrated to Finland from abroad and 10,270 persons emigrated from Finland. The number of immigrants was 340 and the number of emigrants 630 lower than in the corresponding period of the previous year. In all, 6,340 of the immigrants and 7,410 of the emigrants were Finnish citizens.
During the January to September period, 44,430 children were born, which is 980 fewer than in the corresponding period of 2012. The number of deaths decreased by 270 from the year before and amounted to 38,440.
According to the preliminary data, the number of inter-municipal migrations totalled 208,650 by the end of September. Compared with the previous January to September period, the decrease was 6,880 migrations according to the municipal division of 2013.
According to preliminary data by region, the population grew in the following regions in January to September of this year: Uusimaa, Pirkanmaa, North Ostrobothnia, Varsinais-Suomi, Ostrobothnia, Central Finland, Åland, Pohjois-Savo, Central Ostrobothnia and Päijät-Häme.
In the January to September period, the population grew most in absolute numbers in Uusimaa, where it grew by 14,140 persons. The next largest increase in population was seen in Pirkanmaa, 3,040 persons. Relative to the population, population increase was highest in Uusimaa, 9.0 per mil. Relative population growth was second largest in Pirkanmaa, 6.1 per mil. Population loss was highest in absolute numbers in the region of Etelä-Savo that lost 620 persons. The population of Kainuu decreased by 560 persons, which was the second most. Relative to the population, the biggest population loss was found in Kainuu, 7.0 per mil and the second largest in Etelä-Savo, 4.0 per mil.
Most migration gain from intramunicipal and international migration was collected by Uusimaa, 8,870 persons and Pirkanmaa, 2,130 persons. Most migration gain in relative terms was attained by Uusimaa, 5.6 per mil and by Pirkanmaa, 4.3 per mil.
During January to September, migration between regions numbered 99,350. The highest gain from migration between regions was seen in Uusimaa, Pirkanmaa, Varsinais-Suomi, Åland and South Karelia. In absolute numbers, the highest gain from migration between regions was received by Uusimaa, 3,191 persons and Pirkanmaa, 1,310 persons. In both regions, the relative migration gain was also highest; 2.6 per mil of the population in Pirkanmaa and 2.0 per mil in Uusimaa.
Most migration loss both from overall net migration and migration between regions was found in Lapland and Kainuu. Migration loss from overall net migration amounted to 390 persons in Lapland, 2.0 per mil of the population and to 370 persons in Kainuu, 4.9 per mil of the population. Migration loss from migration between regions amounted to 840 persons in Lapland, 4.6 per mil of the population and to 570 persons in Kainuu, 7.1 per mil of the population.
Source: Population and Cause of Death Statistics. Statistics Finland
Inquiries: Eevi Lappalainen 09 1734 3367, Irma Pitkänen 09 1734 3262
Director in charge: Riitta Harala
Publication in pdf-format (304.0 kB)
- Tables
-
Tables in databases
Pick the data you need into tables, view the data as graphs, or download the data for your use.
Appendix tables
- Appendix table 1. Preliminary data on vital statistics by month of occurence 2013 (22.10.2013)
- Appendix table 2. Vital statistics, final data 2005 - 2012 and preliminary data 2013* (22.10.2013)
- Appendix table 3. Comparison between preliminary vital statistics in 2013 and 2012 (22.10.2013)
- Appendix table 4. Preliminary vital statistics by region 2013 and change compared to 2012 preliminary data, quarter 1 - 3 (22.10.2013)
- Appendix table 5. Preliminary data by region on immigrants and emigrants according to country of departure/destination 2013, quarter 1 - 3 (22.10.2013)
- Figures
-
- Appendix figure 1. Live births by quarter 1993 - 2012 and preliminary data 2013 (22.10.2013)
- Appendix figure 2. Deaths by quarter 1993 - 2012 and preliminary data 2013 (22.10.2013)
- Appendix figure 3. Intermunicipal migration by quarter 1993 - 2012 and preliminary data 2013 (22.10.2013)
- Appendix figure 4. Immigration by quarter 1993 - 2012 and preliminary data 2013 (22.10.2013)
- Appendix figure 5. Emigration by quarter 1993 - 2012 and preliminary data 2013 (22.10.2013)
Updated 2.12.2013
Official Statistics of Finland (OSF):
Preliminary population statistics [e-publication].
ISSN=2243-3627. September 2013. Helsinki: Statistics Finland [referred: 3.2.2026].
Access method: http://stat.fi/til/vamuu/2013/09/vamuu_2013_09_2013-10-22_tie_001_en.html

