1. Differences in wealth increased slightly by indebtedness
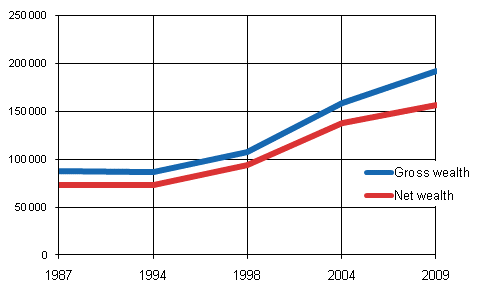
In 2009, the average gross wealth of households amounted to EUR 192,000 and net wealth was EUR 157,000 per household. In real terms, gross wealth had increased by one fifth (21%) from the time of the previous survey in 2004, while net wealth had increased by 14 per cent in this period. The trend of indebtedness has widened the difference between gross and net wealth in recent years (Figure 1). There was a marked growth in wealth from 1998 to 2004, while this growth has since slowed down. The first household wealth survey conducted by Statistics Finland dates back to 1987. From 1987 to 2009, the real value of household gross wealth has increased 2.2-fold.
Figure 1. Gross and net wealth of households in 1987 - 2009, EUR per household

Indebtedness is also reflected in the trend of relative differences in wealth. Relative differences in gross wealth have remained almost unchanged compared to 2004, whereas differences in net wealth have increased somewhat. In 2009, the wealthiest decile owned 39 per cent of gross wealth, which is similar to 2004 levels. The so-called Gini coefficient, which describes wealth differences in a single figure, remained almost unchanged from 2004 to 2009 when looking at gross wealth, but the coefficient for net wealth went up by approximately four percentage points to 66.6 per cent.
Changes in wealth differences do not directly give us information about changes in the amount of wealth. The gross wealth of the wealthiest decile increased by 24 per cent from 2004, exceeding the average change by some three percentage points. While the average of gross wealth in the highest decile increased by EUR 144,000 from 2004, the low values of wealth in the three of the least wealthy deciles have remained almost unchanged. In the two lowest deciles, the values of net wealth are negative, similarly to the years of earlier surveys.
The wealth of Finnish households continues to be based on dwellings, as approximately two thirds of households live in owner-occupied dwellings. The share of owner-occupied dwellings in gross wealth is 56 per cent. The less wealthy do not own dwellings, whereas nearly all households in the highest decile for wealth have an owner-occupied dwelling. Free-time residences come second with a share of approximately 11 per cent. The share of secondary homes and residential investment properties is nine per cent. The proportion of listed shares and mutual funds decreased to less than two per cent during the 1990s recession, but has since increased to about six per cent.
Source: Households' assets
Inquiries: Markku Säylä (09) 1734 3410, Veli-Matti Törmälehto (09) 1734 3680
Director in charge: Riitta Harala
Updated 21.12.2011
Official Statistics of Finland (OSF):
Households' assets [e-publication].
ISSN=2242-3230. 2009,
1. Differences in wealth increased slightly by indebtedness
. Helsinki: Statistics Finland [referred: 19.2.2026].
Access method: http://stat.fi/til/vtutk/2009/vtutk_2009_2011-12-21_kat_001_en.html

