Press release 1.3.2007
Gross domestic product grew by 5.5 per cent last year
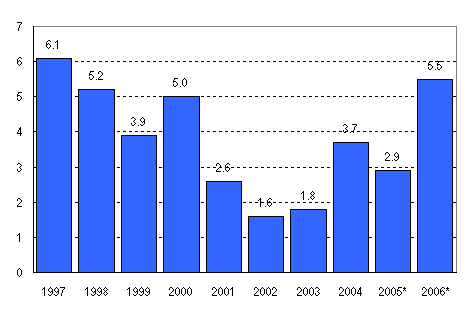
According to Statistics Finland's preliminary data, the volume of Finland's gross domestic product grew by 5.5 per cent in 2006. Gross domestic product, or the totalled up value added of the goods and services produced amounted to EUR 168 billion last year.
In the first quarter of the year, output was 1.9 per cent greater than in the previous quarter. In the second quarter GDP grew by 1.6 per cent, in the third quarter by 0.8 per cent and in the last quarter by 0.9 per cent from the previous quarter.
Volume changes of GDP 1997-2006, %

All demand items of the national economy grew last year. The rate of the growth was fastest in exports whose volume increased by close on 11 per cent. The volume of imports went up by good 5 per cent.
Consumption expenditure went up by 2.3 per cent in all: private final consumption expenditure increased by 3 per cent and public final consumption expenditure by around one per cent. Purchases of durable consumer goods increased by around 6 per cent and those of non-durable goods and services by approximately 2 per cent.
Fixed investments grew by around 5 per cent. The total volume of investments in machinery, equipment and transport equipment grew by 6 per cent. Investments in housing construction increased by 5.7 per cent and those in other building construction by 4 per cent from the year before. Government investments grew by 1.8 per cent and private investments by 5.6 per cent.
In secondary production, value added went up by nearly 10 per cent year-on-year, which was also influenced by the previous year's industrial dispute in the paper industry. Indeed, the value added generated by the wood and paper industry was 15 per cent up on the year before. In the metal industry value added grew by just short of 13 per cent and in other manufacturing by just under 6 per cent. The value added generated by construction grew by just under 5 per cent from the previous year.
In service industries, value added went up by just under 4 per cent. The fastest rate of growth, 6.5 per cent, was recorded in trade. In primary production, value added contracted by 1.5 per cent from the previous year.
Non-financial corporations' profits grew clearly
Non-financial corporations' operating surplus grew by 17 per cent and their entrepreneurial income by 18 per cent from the previous year. Entrepreneurial income roughly corresponds with profit before payment of taxes and dividends. In nominal terms, non-financial corporations' profits were higher than ever before. Non-financial corporations paid 7 per cent more direct taxes than in the previous year.
Non-financial corporations paid 2 per more in dividends than in the year before. Their fixed investments in Finland grew by 9 per cent last year. Non-financial corporations' net lending, or financial position, showed a surplus of EUR 8.5 billion.
Households' real income grew by 1.6 per cent
The disposable income of households increased in nominal terms by 3.5 per cent and in real terms by 1.6 per cent last year. Households' wage income went up by 4.4 per cent, entrepreneurial income by 2 per cent and social security benefits by 2.5 per cent. They paid 3.4 per cent more in direct taxes.
In nominal terms, the final consumption expenditure of households grew by 5 per cent. Their regular income could not quite cover their consumption expenditure, so the savings rate, that is, the proportion of savings relative to disposable income, was -1.5 per cent, having been zero per cent in the year before. Households' indebtedness increased again, so that at the end of September it stood at 94.4 per cent, which was higher than ever before.
General government surplus rose to EUR 6.3 billion
The financial position of central government showed a surplus of EUR 1.6 billion last year. State revenues from taxes went up by 3.6 per cent. Final consumption expenditure went up by only half-a-per cent, but current transfers to local government (incl. repayments of value added tax) increased by 9.5 per cent.
The financial position of local government showed a deficit of EUR 0.5 billion, as against EUR 1 billion in the previous year. Municipalities' tax revenues went up by 6.8 per cent and final consumption expenditure in nominal terms by 4.6 per cent.
The EMU surplus of general government was 3.9 per cent of GDP, or the largest since 2002. The EMU debt amounted to 39.1 per cent of gross domestic product.
The proportion of public expenditure of GDP fell from the previous year's 50.5 per cent to 48.6 per cent. The tax ratio, or the share of taxes and social security contributions of gross domestic product, contracted to 43.5 per cent last year from 44.0 per cent in 2005.
Source: National accounts, Preliminary
annual data and last quarter of 2006. Statistics Finland
General government deficit and gross debt according to EMU
criteria. Statistics Finland
Inquiries:
National accounts: Mr Pasi Koikkalainen +358 9 1734 3332, Mr Olli
Savela +358 9 1734 3316, skt.95@stat.fi
General government deficit and debt: Mr Mika Sainio +358 9 1734
2686, Mr Matti Okko +358 9 1734 3341, rahoitus.tilinpito@stat.fi
Director in charge: Mr Ari Tyrkkö
Related statistical releases:
National
accounts
Quarterly
accounts
General
government deficit and gross debt according to EMU
criteria
Tax
ratio
