

Published: 26 February 2021
Favourable pace of dwelling transactions continued in January
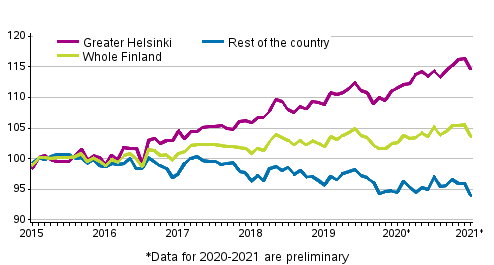
According to Statistics Finland's preliminary data, prices of old dwellings in housing companies rose by 2.7 per cent in Greater Helsinki in January compared to the previous year. In the rest of the country prices fell by 0.6 per cent. Compared to December, prices went down by 1.5 per cent in Greater Helsinki and by 2.1 per cent in the rest of the country. In January, the number of transactions of old dwellings in housing companies made through real estate agents increased by seven per cent compared to one year ago.
Development of prices of old dwellings in housing companies by month 2015–2021M01, index 2015=100
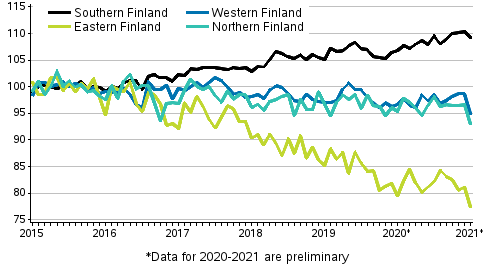
Compared with the corresponding period of the year before, prices of old dwellings in housing companies rose in Southern Finland and fell in other major regions.
Development of prices of old dwellings in housing companies by month in major regions 2015–2021M01, index 2015=100
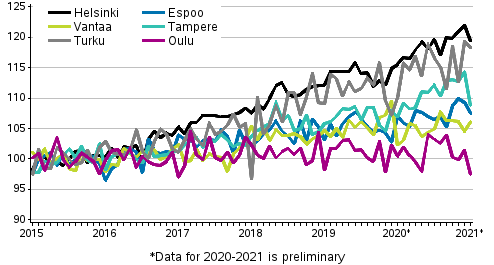
According to preliminary data, prices fell from January 2020 in Oulu and rose in other large towns. Year-on-year changes in prices of dwellings were more moderate in January than in the previous months in Helsinki, Espoo and Tampere. Compared with December, prices rose in Vantaa and fell in other large towns.
Development of prices of old dwellings in housing companies by month in large cities in 2015 to 2021M01, index 2015=100
Prices per square metre of old dwellings in housing companies, January 2021 1)
| Area | Price, EUR/m� | Index 2015=100 | Monthly change, % | Yearly change, % |
| Whole country | 2,173 | 103.6 | -1.8 | 1.0 |
| Greater Helsinki | 3,907 | 114.6 | -1.5 | 2.7 |
| Rest of the country (whole country - Greater Helsinki) | 1,667 | 94.0 | -2.1 | -0.6 |
| Satellite municipalities 2) | 2,214 | 96.3 | -3.1 | -2.3 |
| Helsinki | 4,563 | 119.4 | -2.1 | 3.3 |
| Espoo-Kauniainen | 3,624 | 107.5 | -1.7 | 0.5 |
| Vantaa | 2,708 | 106.1 | 1.5 | 3.7 |
| Tampere | 2,543 | 108.8 | -4.8 | 1.8 |
| Turku | 2,277 | 118.3 | -0.9 | 7.4 |
| Oulu | 1,710 | 97.5 | -3.8 | -2.9 |
2) Satellite municipalities = Hyvink��, J�rvenp��, Kerava, Kirkkonummi, Nurmij�rvi, Riihim�ki, Sipoo, Tuusula and Vihti
The statistics on the prices of old dwellings in housing companies are based on the Tax Administration's data on dwellings (data on ownership of dwellings in housing companies). The numbers published from data on dwellings should not be used to assess the activeness of transactions in the latest periods. Due to the change in data, the numbers calculated from the Tax Administration's data on dwellings are not comparable with periods periods starting from the last quarter of 2019.
When the monthly statistics on prices of old dwellings in housing companies are published for the first time, they cover approximately 70 per cent of all transactions made in the latest statistical reference month. The monthly data become revised during the following months so that the final data for the year are published in the release concerning the first quarter of the following year. Further information about data revisions can be found in separate tables.
The numbers of old dwellings in housing companies sold through real estate agents are based on the data from the price monitoring service of the Central Federation of Finnish Real Estate Agencies. As a rule, these data do not become revised retrospectively.
Data on prices of dwellings in housing companies in different areas and by house type are available at stat.fi/til/ashi/tau_en.html. The tables also contain data on the prices per square metre at the municipal and postal code levels and on the numbers of transactions. If only a few transactions are known in the area, a couple of deviating cases may significantly affect the average price for an area and the price index. Instead of individual monthly and annual changes, the development of prices should be examined over a longer time period and not only for a particular point in time.
Source: Prices of dwellings in housing companies, Statistics Finland
Inquiries: Petri Kettunen 029 551 3558, Elina Vuorio 029 551 3385, asuminen.hinnat@stat.fi
Head of Department in charge: Hannele Orjala
Publication in pdf-format (364.6 kB)
- Tables
-
Tables in databases
Pick the data you need into tables, view the data as graphs, or download the data for your use.
Appendix tables
- Quality descriptions
- Revisions in these statistics
-
- Revisions in these statistics (26.2.2021)
Updated 26.2.2021
Official Statistics of Finland (OSF):
Prices of dwellings in housing companies [e-publication].
ISSN=2323-8801. January 2021. Helsinki: Statistics Finland [referred: 2.8.2026].
Access method: http://stat.fi/til/ashi/2021/01/ashi_2021_01_2021-02-26_tie_001_en.html