Earnings development can be measured through various indices
The development of wage and salary earners' nominal earnings has been measured in Finland with the index of wage and salary earnings since 1948. The index of wage and salary earnings measures the development of wage and salary earners' earnings for regular working hours and it includes performance-based bonuses and agreement-based non-recurring items.
The index for regular earnings is calculated alongside the index of wage and salary earnings. The index for regular earnings does not include performance-based bonuses and non-recurring items included in collective agreements. Otherwise the calculation method and data are the same as for the index of wage and salary earnings.
Once a year, Statistics Finland publishes the index standardised with the main category of occupation based on the data of the index for regular earnings. In the index standardised with the main category of occupation the shares of the main categories of occupation for each wage and salary earner group are standardised based on the wage and salary sum weights of 2010. Publishing of the index standardised with the main category of occupation is one way to illustrate the effects of structural changes on general earnings development and in sector-specific comparisons such as comparisons between employer sectors.
In central government, changes in occupational structure did not raise average earnings last year
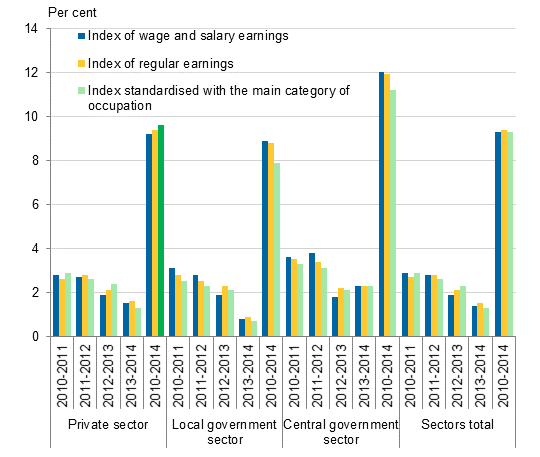
Figure 1 shows the development of the index of wage and salary earnings, the index for regular earnings and the index standardised with the main category of occupation in 2010 to 2014. Here, the last quarter of the year is examined. The examination starts from 2010 because earnings development data standardised with the main category of occupation are available starting from 2010.
Figure 1. Change in earnings in 2010 to 2014 by employer sector according to the index of wage and salary earnings 2010=100, the index of regular earnings 2010=100, and the index standardised with the main category of occupation

The figure shows that the development of the index standardised with the main category of occupation has been slower in the 2010s in the central and local government sectors than the development of the index of wage and salary earnings and the index for regular earnings.
This indicates that in the public sector, the changes in occupational structure have accelerated the rise in average earnings. In higher occupational groups, wage and salary earners usually have a higher university degree, and in these occupations the earnings level is also higher than average. For example, the share of professionals has increased in central government in the 2010s. This has resulted in a higher increase in the average earnings of all wage and salary earners in central government than the average pay increases, because the earnings level of professionals is higher than the average earnings level in the central government sector. This development is visible in Figure 1 and in particular at the beginnings of the 2010s. In 2014, the index standardised with the main category of occupation rose in the central government sector by as much as the index of wage and salary earnings and the index for regular earnings, which indicates that the development described above seems to have stopped in central government.
In the private sector, the situation is the opposite, or the development of the index standardised with the main category of occupation has been faster than the development of the index of wage and salary earnings and the index for regular earnings (Figure 1) in 2010 to 2014. The development in the private sector is explained by that the share of managers has fallen in the 2010s. The drop in the share of managers means that the rise in average earnings in the private sector has slowed down, because the earnings level of managers is higher than the average earnings level in the private sector. On the other hand, the share of the occupational group of service and sales workers grew in the private sector in the early 2010s. This also means that the rise in average earnings has slowed down in the private sector, because the earnings level of service and sales workers is lower than the average earnings level in the private sector.
Managers in the private sector have had the fastest earnings development in the 2010s
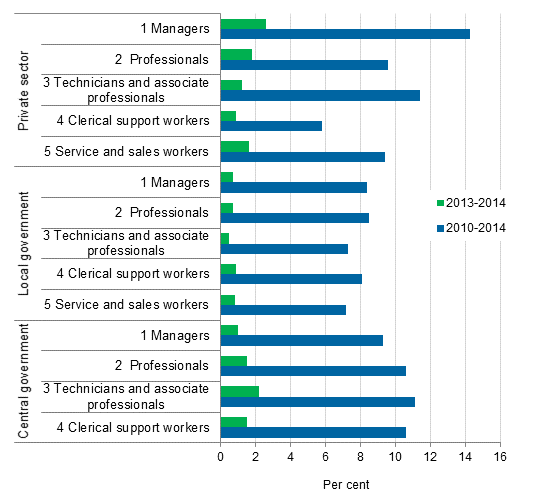
When the changes are examined by main categories of occupation (managers, professionals, experts, office and customer service workers, service and sales workers) it becomes evident that in the private sector, earnings developed fastest in the highest occupational groups last year (managers and professionals). Figure 2 shows that the earnings of managers grew by 2.6 per cent and that of professionals by 1.8 per cent. The earnings development of managers in the private sector has also been fastest in total during 2010 to 2014 (14.3 per cent). The top management of enterprises is not included in this examination because employers do not provide Statistics Finland with these data.
Figure 2. Change in earnings in 2013 to 2014 and in 2010 to 2014 in total, by employer sector and by main categories of occupation

In the local government sector, earnings development in the above mentioned main categories of occupation was quite stable last year and also in 2010 to 2014 in total. In central government, experts had the fastest earnings development both in 2014 and in 2010 to 2014 in total. Service and sales workers have been excluded from the central government examination because the share of this occupational group is low in central government. In the local government sector and private sector, the share of service and sales workers is the third largest following professionals and experts.
Source: Index of wage and salary earnings 2015, 2nd quarter. Statistics Finland
Inquiries: Anu Uuttu 029 551 2322, Harri Nummila 029 551 3235, palkat.indeksit@stat.fi
Director in charge: Hannele Orjala
Updated 27.8.2015
Official Statistics of Finland (OSF):
Index of wage and salary earnings [e-publication].
ISSN=1798-7814. 2nd quarter 2015,
Earnings development can be measured through various indices
. Helsinki: Statistics Finland [referred: 16.2.2026].
Access method: http://stat.fi/til/ati/2015/02/ati_2015_02_2015-08-27_kat_001_en.html

