Published: 10 December 2020
Energy prices decrease in the third quarter of 2020 compared to corresponding quarter of the year before
Corrected on 12 December. The Correction is indicated in red.
In the third quarter of 2020, energy prices were lower than in the corresponding quarter of the year before, except for forest chippings. The magnitude of the drop in prices varied by energy source. The biggest change occurred in the prices of crude oil.
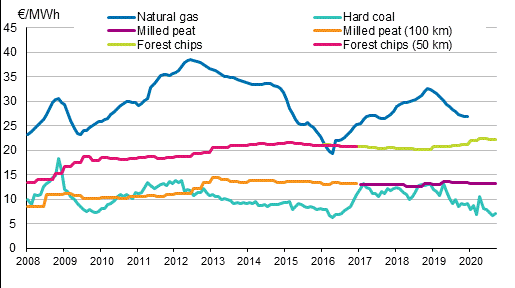
2)Fuel prices in electricity production

The world market price of crude oil rose and evened out to good USD 40 per barrel after the price plunge in March. The current price level is around two-thirds of the previous year's price level. The changes in world market prices have been visible in the consumer prices of oil products. Despite the tax increase in August, the price of motor gasoline was six per cent lower in September and that of diesel oil nearly 11 per cent lower than one year earlier. The corresponding drop in the price of light fuel oil was 28 per cent. Consumer prices were at their lowest in May.
The excise duty on liquid transport fuels rose at the beginning of August. The price effect of the tax change is estimated to be on average 5.3 cents per litre for motor gasoline and its substitutes and 5,6 cents per litre for diesel and its substitutes. The tax will pass on to consumer prices over a longer period .
The fluctuation in the import price of hard coal in the early part of the year turned to a downward trend in the summer. In the third quarter of the year, the tax-free price of hard coal was almost one quarter lower than one year previously.
The gas market in Finland was liberalised at the beginning of 2020. For the time being, data concerning the price development of natural gas are too uncertain to be published. Collection of data by customer group has started and the first data are due to be published in spring 2021.
Of domestic fuels, the rise in the price of forest chippings turned to a slight decrease in the third quarter of the year. Compared with the previous quarter, the price was one percentage point lower. Compared to the third quarter of 2019, the price was five per cent higher. The price of milled peat also decreased slightly. Compared with both the previous quarter and one year ago, the price of milled peat was around one per cent lower.
The system price of the Nord Pool electricity market derived from the sell and buy bids on the exchange market made a slight upturn in August, which reflects the seasonal variations in the price of electricity. In the Nordic countries, the demand for electricity, and thus also the price, is usually at its lowest in summer and at its highest in winter. In July, the system price was record low. The current year has been exceptional in terms of both production and demand. There has been plenty of water and wind power, and warm weather and weak economic development have lowered the demand.
The area price for Finland has been higher than the system price already for a long time. In the exceptional circumstances this year, the price difference has become large because the available transmission capacity has not been sufficient to level off the price differences of the market area. However, compared with the previous year the area price for Finland has decreased. In autumn, the area price for Finland was just under one third lower than in the year before.
The fall in the market prices of electricity was also visible in consumer prices. The energy prices of consumer customers fell in all customer groups by around four percentage points compared to the quarter one year ago. The price development for enterprise customers was not uniform. These data derive from Statistics Finland’s Price inquiry on electrical energy.
1) The heading of the release was corrected on 11 December 2020.
2) The last sentence of the lead paragraph was removed on 11 December 2020.
Source: Statistics Finland, Energy prices
Inquiries: Virve Rouhiainen 029 551 3527, energia@stat.fi
Head of Department in charge: Mari Ylä-Jarkko
Publication in pdf-format (354.5 kB)
- Tables
-
Tables in databases
Pick the data you need into tables, view the data as graphs, or download the data for your use.
Appendix tables
- Figures
-
- Appendix figure 1. Import prices of oil (10.12.2020)
- Appendix figure 2. Consumer prices of principal oil products (10.12.2020)
- Appendix figure 3. Fuel prices in heat production (10.12.2020)
- Appendix figure 4. Fuel prices in electricity production (10.12.2020)
- Appendix figure 5. Price of electricity by type of consumer (10.12.2020)
- Appendix figure 6. Average monthly spot prices at the Nord Pool Spot power exchange (10.12.2020)
Updated 10.12.2020
Statistics:
Energy prices [e-publication].
ISSN=1799-800X. 3rd quarter 2020. Helsinki: Statistics Finland [referred: 5.2.2026].
Access method: http://stat.fi/til/ehi/2020/03/ehi_2020_03_2020-12-10_tie_001_en.html

