2. Prevalence of innovation activity in enterprises
Of the surveyed enterprises, 65 per cent reported that they had had innovation activity in 2014 to 2016. This was about ten percentage points more than in previous surveys, where the share of those reporting innovation activity has varied between 52 and 56 per cent.
The majority of those having had innovation activity engaged in innovation activity related to products and processes. In all, 58 per cent of enterprises reported development or implementation of product and process innovations, which is also considerably higher than before. In previous surveys, nearly one-half of enterprises have reported innovation activity related to products and processes. Implementation of marketing and organisational innovations was also reported more often than earlier. They had been adopted by 46 per cent of enterprises, while in earlier surveys, the share has been nearly 40 per cent.
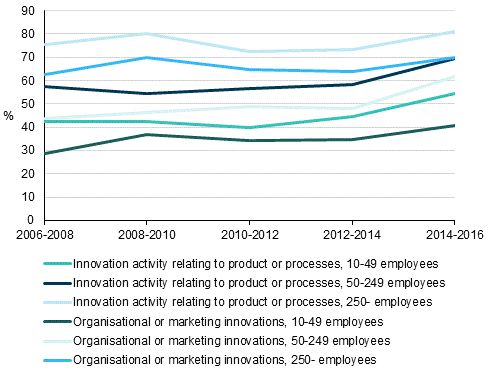
Although for services, innovation activity appeared to have become more general already in the previous survey, now the implementation of innovations became clearly more common throughout; for all types of innovation activity, both in manufacturing and services, and also in all size categories.
Figure 1. Prevalence of innovation activity in 2006 to 2016, share of enterprises
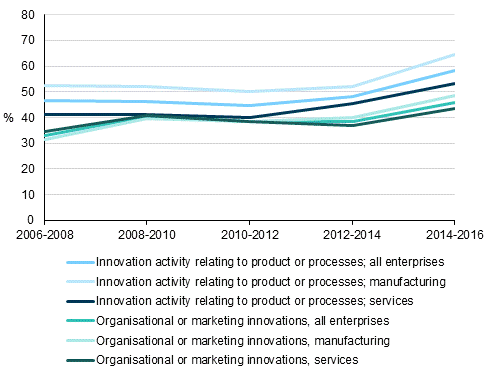
Figure 2. Prevalence of innovation activity by size category of personnel in 2006 to 2016, share of enterprises
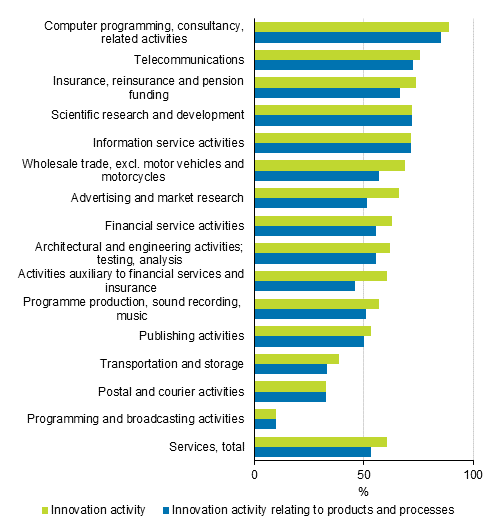
In manufacturing, seven out of ten enterprises reported innovation activity in 2014 to 2016. In services, the respective share was 60 per cent.
As in the previous surveys, enterprises in the manufacture of computer, electronic and optical products reported innovation activity most commonly, 92 per cent of all enterprises in the field. In services, the share of those with innovation activity was highest – as in previous years – in computer programming, where 89 per cent of enterprises had had innovation activity.
In some industries, the shares of those reporting innovation activity remained relatively unchanged from one year to another, and the same industries are often found in the top positions of the comparison. The share of the manufacture of computer, electronic and optical products has been close to 90 per cent already in a couple of surveys, the share of the manufacture of chemicals and chemical products has been at around 80 per cent and the paper industry between 60 to 70 per cent. The share has varied on both sides of 70 per cent in the manufacture of machinery and equipment, while in services, telecommunications, information service activities and research have shown similar figures.
The increase seen in total results for those having reported innovation activity concerned now more or less the entire business activity, because the share of those having reported innovation activity grew in nearly all industries compared with the previous surveys.
Figure 3. Prevalence of innovation activity in manufacturing by industry in 2014 to 2016, share of enterprises
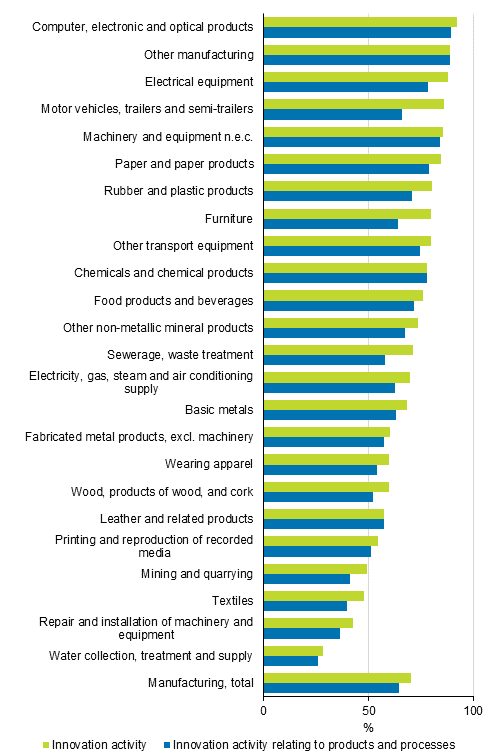
Figure 4. Prevalence of innovation activity in services by industry in 2014 to 2016, share of enterprises
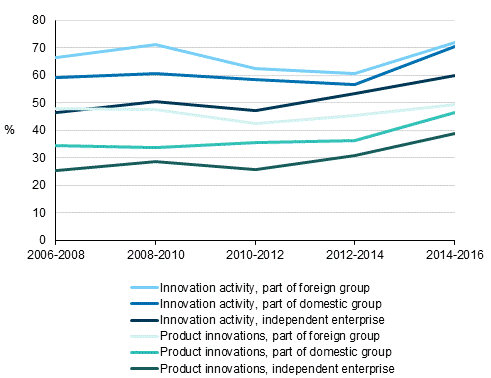
Enterprises belonging to groups, particularly to foreign groups, have conventionally reported innovation activity more often than independent enterprises, but the difference seems to have narrowed down somewhat. When in 2006 to 2008, every fourth independent enterprise reported introduction of product innovations and 46 per cent innovation activity at all, the shares were 39 and 60 per cent in 2014 to 2016. Compared with enterprises belonging to foreign groups, the difference of 20 percentage points has thus narrowed now to ten percentage points. Simultaneously, enterprises belonging to Finnish groups have reached the shares of innovating enterprises belonging to foreign groups, and even passed them in the prevalence of process innovations.
Figure 5. Prevalence of innovation activity by form of enterprise in 2006 to 2016, share of enterprises
Innovation activity also becomes more commonplace the wider markets the enterprises operate on. In the light of the results, this is particularly visible in the introduction of product innovations to the markets and implementation of marketing innovations. For example, 30 per cent of those operating only in domestic markets introduced product innovations in 2014 to 2016. Sixty-one per cent of enterprises that had markets outside the EU launched product innovations.
Source: Innovation 2016, Statistics Finland
Inquiries: Mervi Niemi 029 551 3263, Heidi Pirkola 029 551 3246, tiede.teknologia@stat.fi
Director in charge: Sami Saarikivi
Updated 12.4.2018
Official Statistics of Finland (OSF):
Innovation [e-publication].
ISSN=1797-4399. 2016,
2. Prevalence of innovation activity in enterprises
. Helsinki: Statistics Finland [referred: 20.2.2026].
Access method: http://stat.fi/til/inn/2016/inn_2016_2018-04-12_kat_002_en.html

