13. Acquisition of technical services and machinery, equipment and software
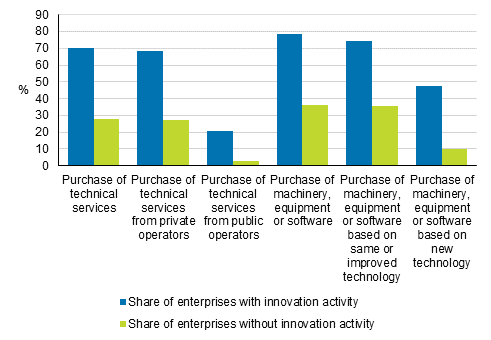
Technical services, which include any consulting activity that involves any kind of technical and scientific information, with various engineering services, testing services, industrial design services, R&D services and the like, were purchased by 70 per cent of enterprises with innovation activity. The majority of them, 68 per cent, purchased services from the private sector. Every fifth enterprise with innovation activity purchased technical services from the public sector, that is, public research organisations, universities and universities of applied sciences.
Considerably fewer, good one-quarter of enterprises with no innovation activity in 2016 to 2018 purchased technical services during the survey period. Purchases were focused on acquisitions from the private sector and only three per cent of the enterprises in the group acquired technical services from the public sector.
The acquisition of technical services was more common in manufacturing enterprises than in service industries. In the largest size category 80 per cent of manufacturing enterprises with innovation activity purchased technical services produced by the public sector. In the biggest enterprises in services the corresponding share was one quarter.
As with the acquisition of technical services, the acquisition of machinery and equipment and software was considerably more common in innovating enterprises than in other enterprises in 2016 to 2018. Three out of four innovating enterprises acquired the same or improved technology used before in the enterprise. Nearly one half acquired technology that was new to the enterprise.
Of other enterprises 35 per cent purchased technology similar to that used before and every tenth enterprise new technology.
Innovating enterprises of all sizes made technology acquisitions very generally both in service industries and manufacturing.
Figure 19. Prevalence of acquisition of technical services and machinery, equipment and software in 2016 to 2018

Further information about the prevalence of acquisitions of technical services and machinery and equipment
Protection and IPR measures and acquisition of knowledge and technology in enterprises by industry group and enterprise size categoryProtection and IPR measures and acquisition of knowledge and technology in enterprises by industry
Source: Innovation 2018, Statistics Finland
Inquiries: Mervi Niemi 029 551 3263, Heidi Pirkola 029 551 3246, tiede.teknologia@stat.fi
Director in charge: Mari Yl�-Jarkko
Updated 23.4.2020
Official Statistics of Finland (OSF):
Innovation [e-publication].
ISSN=1797-4399. 2018,
13. Acquisition of technical services and machinery, equipment and software
. Helsinki: Statistics Finland [referred: 20.2.2026].
Access method: http://stat.fi/til/inn/2018/inn_2018_2020-04-23_kat_015_en.html

