Published: 26 November 2013
Amount of burnt municipal waste increased close on million tonnes
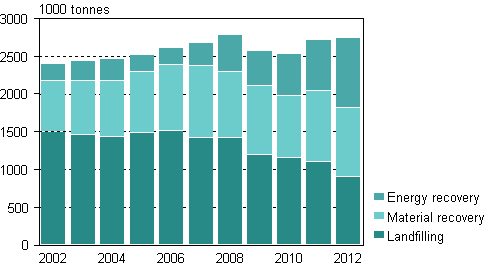
Last year, approximately 0.9 million tonnes of municipal waste was delivered to treatment plants for incineration. The share of incineration in treatment of municipal waste grew to one-third, close to the average in western European countries. Mixed municipal waste, in particular, was burned more than before, the amount grew to 520,000 tonnes. Burning of mixed municipal waste started to become more common after 2006, when it was only one-fifth of the current level.
Municipal waste by treatment method in 2002–2011

Simultaneously, in 2012 the amount of municipal waste at landfills dropped below one million tonnes for the first time in decades. Altogether, 901,000 tonnes of waste was deposited at landfills, of which almost all, 97 per cent, was mixed municipal waste. The share of landfills in treatment of municipal waste decreased to 33 per cent. Five years ago, one-half of municipal waste was still transported to landfill sites.
All in all, the amount of municipal waste grew to 2.74 million tonnes in 2012. Slightly under one-half of municipal waste was collected separately, that is, sorted where it was generated, either for recycling or incineration. The largest separately collected waste components in descending order were paper and board waste, organic waste, metal waste, electrical and electronic waste, wood, plastic and glass waste. In addition, energy waste that consists of several types of materials was also collected separately.
In 2012, municipal waste was recycled or utilised as material to the same amount as in previous years, around one-third of all waste. The growth in the burning of municipal waste has not decreased the share of recycling in waste treatment.
Source: Statistics Finland - Waste statistics
Inquiries: Juha Espo 09 1734 3463, Simo Vahvelainen 09 1734 3457, ymparisto.energia@stat.fi
Director in charge: Leena Storgårds
Publication in pdf-format (213.1 kB)
- Tables
-
Tables in databases
Pick the data you need into tables, view the data as graphs, or download the data for your use.
Appendix tables
- Appendix table 1. Municipal waste in 2012, tonnes (26.11.2013)
Updated 26.11.2013
Official Statistics of Finland (OSF):
Waste statistics [e-publication].
ISSN=2323-5314. 2012. Helsinki: Statistics Finland [referred: 18.2.2026].
Access method: http://stat.fi/til/jate/2012/jate_2012_2013-11-26_tie_001_en.html

