1. Background analysis of candidates and elected councillors in Municipal elections 2012
In the following review, persons entitled to vote and background information on the candidates nominated by the parties and constituency associations and those elected to municipal councils are examined against diverse statistical data. The data on persons entitled to vote derive from the voting register established on 12 September 2012 and the data on the candidates from the candidate register set up on 27 September 2012. The background data are based on statistical data from Statistics Finland’s Population Statistics Department, such as population, employment and family statistics and the Register of Completed Education and Degrees.
The candidates and elected councillors are also examined by party in the analysis. The parties with the highest numbers of candidates are given in the tables and figures separately. The group "Others" includes candidates from the Pirate Party, Independence Party, Communist Workers Party, Change 2011, Finnish Labour Party, Liberty Party, For the Poor and constituency associations.
The candidates differ in their age and sexual structure from all persons entitled to vote. Considerably fewer of the candidates are aged 30 or under and 70 or over than the persons entitled to vote, and more of the candidates are men than women. This should be taken into consideration when comparing the candidates with persons entitled to vote. In the tables and figures of this analysis the data are not age-standardised. Standardisation would slightly lower the difference between the candidates and those entitled to vote for example when comparing the level of education, main type of activity, family status and socio-economic group among the candidates and persons entitled to vote.
1.1. Candidates, elected councillors and persons entitled to vote by sex
Majority of candidates and elected councillors are menA total of 37,125 candidates were nominated for the Municipal elections. This is 1,384 fewer candidates than in 2008. Nearly all parties have a lower number of candidates than in the previous Municipal elections. Only the True Finns and the Green League were able to nominate more candidates than in the 2008 elections. In the 2008 elections, the True Finns had 1,840 candidates, now in the 2012 elections 4,394 candidates. The Centre Party of Finland has the highest number of candidates, 8,401, although the total number of candidates fell most in that party. (Table 1.)
Table 1. Number of candidates by party in Municipal elections 2012 and 2008
| Party | 2012 | 2008 | change, number |
change, % |
| Candidates total |
37,125 | 38,509 | -1,384 | -3.6 |
| True Finns PS |
4,394 | 1,840 | 2,554 | 138.8 |
| Green League GREENS |
2,299 | 2,192 | 107 | 4.9 |
| Christian Democrats in Finland KD |
1,870 | 1,921 | -51 | -2.7 |
| Swedish People's Pty in Finland RKP |
1,350 | 1,407 | -51 | -4.1 |
| Finnish Social Democratic Pty SDP |
6,987 | 7,702 | -715 | -9.3 |
| National Coalition Pty KOK |
6,874 | 7,628 | -754 | -9.9 |
| Left Alliance LEFT |
3,506 | 4,112 | -606 | -14.7 |
| Centre Pty of Finland CENT |
8,401 | 9,977 | -1,576 | -15.8 |
| Communist Pty of Finland SKP |
304 | 362 | -58 | -16.0 |
| Others | 1,140 | 1,368 | -228 | -16.7 |
A total of 9,674 councillors were elected to the municipal councils. Compared with 2008, the number was 738 lower. The number of elected councillors fell because of municipal mergers that had taken place between the elections. With the exception of the True Finns and the Communist Party of Finland, the number of elected councillors went down in all parties. The number of councillors elected from the Communist Party of Finland remained unchanged, at nine councillors. The True Finns nearly tripled their number of councillors from the previous elections, gaining 752 additional seats in municipal councils. (Table 2.)
The Left Alliance lost in relative terms the most council seats: the figure was down by around 25 per cent from the previous elections (193 councillors).
Over one half of the elected councillors (57%) were old councillors. In all, 162 of the elected were Members of Parliament.
Table 2. Number of elected councillors by party in Municipal elections 2012 and 2008
| Party | 2012 | 2008 | change, number |
change, % |
| Elected councillors, total |
9,674 | 10,412 | -738 | -7.1 |
| True Finns PS |
1,195 | 443 | 752 | 169.8 |
| Green League GREENS |
323 | 370 | -47 | -12.7 |
| Christian Democrats in Finland KD |
300 | 351 | -51 | -14.5 |
| Swedish People's Pty in Finland RKP |
480 | 511 | -31 | -6.1 |
| Finnish Social Democratic Pty SDP |
1,729 | 2,066 | -337 | -16.3 |
| National Coalition Pty KOK |
1,735 | 2,020 | -285 | -14.1 |
| Left Alliance LEFT |
640 | 833 | -193 | -23.2 |
| Centre Pty of Finland CENT |
3,077 | 3,518 | -441 | -12.5 |
| Communist Pty of Finland SKP |
9 | 9 | 0 | 0.0 |
| Others | 186 | 291 | -105 | -36.1 |
Women make up 38.8 per cent of the candidates. The majority, or 51.4 per cent, of the persons entitled to vote are women. The proportion of female candidates fell by 1.6 percentage points from the 2008 Municipal elections. Only the Green League has more female than male candidates (56.8 per cent). The Christian Democrats have the second highest number of female candidates, as their proportion of women is 45.3 per cent. The proportion of women is around 40 per cent in the Coalition Party, the Centre Party and the Social Democratic Party. The percentage of female candidates is lowest among the True Finns, only 23 per cent, and in the Communist Party of Finland, 33 per cent. (Figure 1.)
The percentage of female candidates is highest in the region of Uusimaa, at 41.9 per cent, and lowest in South Ostrobothnia, at 36.0 per cent.
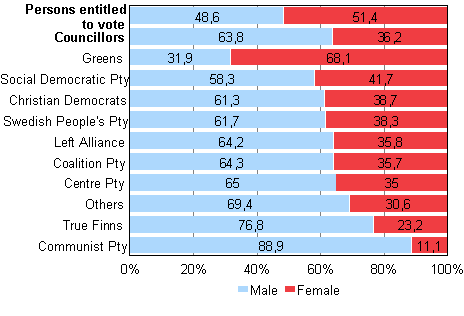
The proportion of women of the elected councillors is slightly smaller than their proportion of all candidates, namely 36.2 per cent. The proportion of women is a few percentage points higher among new elected councillors. A distinct majority of the elected Greens are women, 68.1 per cent. Women account for 23.2 per cent of the elected True Finns and 11.1 per cent of the elected Communist Party of Finland councillors are women. (Figure 2.)
Figure 1. Persons entitled to vote, candidates (by party) and elected councillors by sex in Municipal elections 2012, %
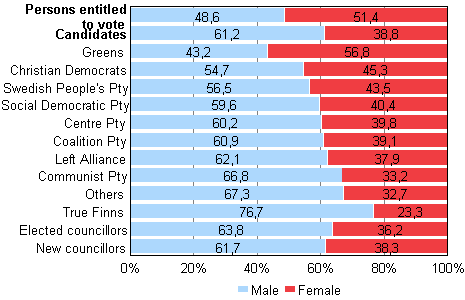
Figure 2. Persons entitled to vote and elected councillors (by party) by sex in Municipal elections 2012, %
1.2. Candidates, elected councillors and persons entitled to vote by age group and average age of the candidates and councillors by party
The average age of the candidates is now around one year higher than in the previous elections. The average age of male candidates is now 49.8 years and that of female candidates 47.0 years. Female candidates are, on average, nearly four years younger than female voters, whereas male candidates are more or less of the same age as male voters. The average age of persons entitled to vote has risen by nearly one year since the previous Municipal elections. On the day of the election the average age of persons entitled to vote is now 48.1 for men and 50.8 for women.
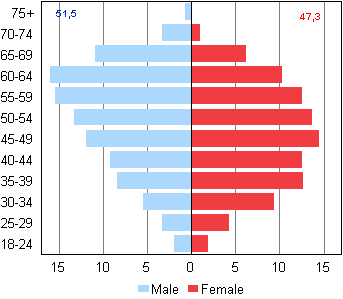
The elected councillors are slightly older than the candidates are. The average age of elected male councillors is 51.5 years and that of female councillors 47.3 years. The average age has risen by nearly one year from the previous elections. New councillors are, on average, four years younger: the average age of new male councillors is 47.6 years and that of female councillors is 44.1 years.
The age structure of the candidates is very different from that of persons entitled to vote (Figures 3 and 4.). The age pyramid of neither group is no longer a pyramid as the name indicates: the age group of persons entitled to vote rather resembles a tower and that of candidates an onion, from which it can be seen that both the youngest and oldest age groups are missing. Most male candidates represent the age group of those aged 55 to 64 and most female candidates the age group of those aged 44 to 54.
The age of the elected councillors is more focused on the middlemost age groups than that of the candidates: for men the age groups 55 to 64 and for women the age groups 45 to 54. Of the candidates, 17.8 per cent are aged under 35, while this is so for 12.7 per cent of the elected councillors. The proportion of those aged 64 or over is smaller among the elected councillors than among the candidates. (Figure 5.)
Figure 3. Age distributions and average age of persons entitled to vote by sex in Municipal elections 2012, %
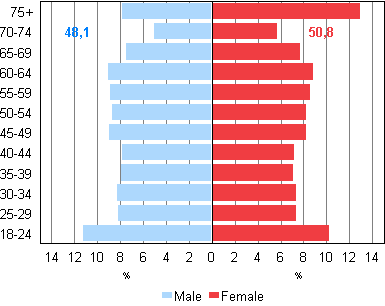
Figure 4. Age distributions and average age of candidates by sex in Municipal elections 2012, %
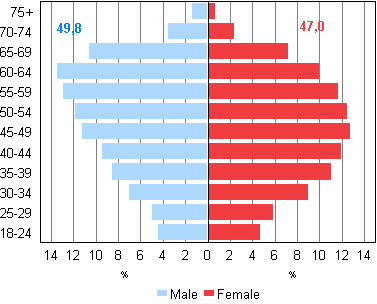
Figure 5. Age distributions and average age of elected councillors by sex in Municipal elections 2012, %
Examined by party, the Communist Party has the oldest candidates: over 40 per cent of their candidates are aged 60 or over and the average age is 52.4 years. In turn, the Green League candidates are the youngest. Over 40 per cent of the Green League candidates are aged 40 or under, and the average age of the candidates is 43.1 years. Around 27 per cent of the candidates of all parties are aged 40 or under and around 26 per cent are aged 60 or over. The differences in the ages of candidates by party are fairly small: the average age of female candidates from all parties is a few years lower than that of male candidates, with the exception of the Green League and the Christian Democrats.
Of the elected councillors, those from the Communist Party of Finland are the oldest, 57.3 years, on average and the Green League councillors at 43.7 are the youngest.
Figure 6. Persons entitled to vote, candidates (by party) and elected councillors by age group in Municipal elections 2012, %
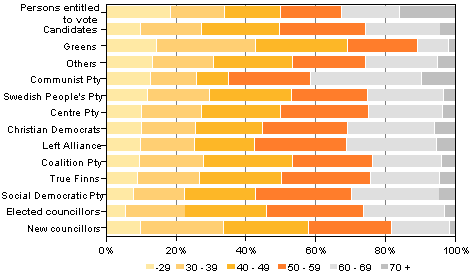
Table 3. Persons entitled to vote, candidates (by party) and elected councillors by age group in Municipal elections 2012, %
| 18-29 | 30-39 | 40-49 | 50-59 | 60-69 | 70+ | |
| Persons entitled to vote |
18.6 | 15.4 | 17.3 | 18,4 | 16.6 | 16.0 |
| Candidates | 10.0 | 17.4 | 22.3 | 24.6 | 21.4 | 4.3 |
| Green League GREENS |
14.7 | 28.3 | 26.2 | 20.0 | 8.9 | 1.9 |
| Others | 13.3 | 17.5 | 22.6 | 20.9 | 20.5 | 5.1 |
| Communist Pty of Finland SKP |
12.8 | 13.2 | 9.4 | 23.4 | 31.9 | 9.5 |
| Swedish People's Pty in Finland RKP |
12.1 | 17.5 | 23.6 | 21.8 | 21.6 | 3.4 |
| Centre Pty of Finland CENT |
10.2 | 17.1 | 22.8 | 25.1 | 21.2 | 3.6 |
| Christian Democrats in Finland KD |
10.2 | 15.5 | 19.3 | 24.2 | 25.0 | 5.9 |
| Left Alliance LEFT |
10.1 | 15.4 | 17.1 | 26.3 | 25.8 | 5.3 |
| National Coalition Pty KOK |
9.6 | 18.5 | 25.5 | 22.8 | 19.6 | 4.0 |
| True Finns PS |
9.1 | 17.8 | 23.5 | 25.4 | 19.6 | 4.5 |
| Finnish Social Democratic Pty SDP |
7.9 | 14.7 | 20.3 | 27.4 | 25.1 | 4.6 |
| Councillors | 5.7 | 17.0 | 23.3 | 27.8 | 23.2 | 3.0 |
| Councillors, new | 10.1 | 23.7 | 24.4 | 23.6 | 16.6 | 1.7 |
Table 4. Average age of candidates and elected councillors by party in Municipal elections 2012
| Total | Men | Women | ||||
| Persons entitled to vote |
49.5 | 48.1 | 50.8 | |||
| Party | Candidates | Councillors | Candidates | Councillors | Candidates | Councillors |
| Total | 48.7 | 50.0 | 49.8 | 51.5 | 47.0 | 47.3 |
| National Coaltion Pty KOK |
48.1 | 49.3 | 49.1 | 50.6 | 46.5 | 47.0 |
| Finnish Social Democratic Pty SDP |
50.6 | 52.0 | 51.8 | 53.9 | 48.7 | 49.2 |
| True Finns PS |
48.6 | 49.1 | 49.0 | 50.1 | 47.1 | 45.7 |
| Centre Pty of Finland CENT |
48.5 | 49.3 | 49.8 | 50.7 | 46.6 | 46.8 |
| Green League GREENS |
43.1 | 43.7 | 43.4 | 45.6 | 42.8 | 42.8 |
| Left Alliance LEFT |
50.3 | 52.6 | 51.6 | 54.9 | 48.2 | 48.6 |
| Swedish People's Pty in Finland RKP |
47.9 | 49.9 | 49.5 | 51.6 | 45.7 | 47.1 |
| Christian Democrats in Finland KD |
50.0 | 52.6 | 50.0 | 53.8 | 50.0 | 50.8 |
| Communist Pty of Finland SKP |
52.4 | 57.3 | 53.2 | 57.0 | 50.8 | 60.0 |
| Others | 47.6 | 51.1 | 47.6 | 51.8 | 47.7 | 49.5 |
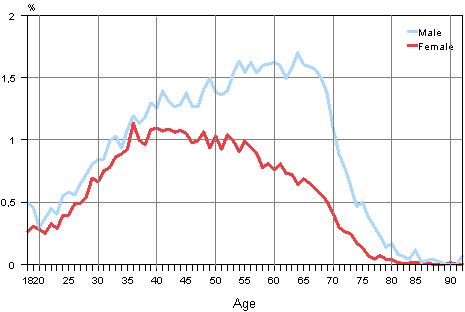
Altogether 1.5 per cent of men and 0.7 per cent of women were nominated as candidates. In all age groups fewer women were nominated than men. The participation rate as candidates rises sharply for both sexes until the age of 35, after which the proportion of female candidates per age group remains at around 1.1 per cent and turns downwards slightly after the age of 50. In turn, men's participation rate still grows until the age of 53. The proportion of male candidates per age group is at its highest in ages 53 to 67, when around 1.5 to 1.7 per cent of each 1-year age group are candidates (Figure 7).
Figure 7. Proportion of candidates in age group in Municipal elections 2012, %
For the elected councillors the proportions by 1-year age group are around 0.5 per cent at their highest. The shape of the curve is in its general outline very similar to that of the candidates. For those aged under 35 the proportion of the elected men and women in the age group are on the same level - in the candidates women's proportion of the age group is lower than that of men. (Figure 8.)
Figure 8. Proportion of councillors in age group in Municipal elections 2012, %
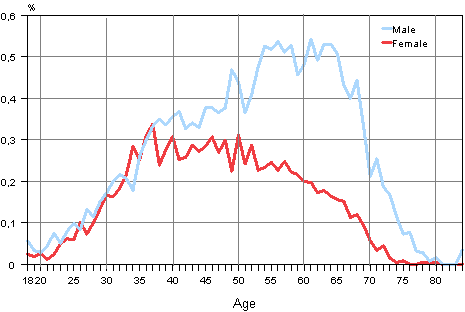
Table 5. Party distribution of candidates by size of municipality in Municipal elections 2012, %
| Tot. | Size category of municipality |
|||||||
| - 1,999 | 2,000 - 4,999 | 5,000 - 9,999 | 10,000 - 19,999 | 20,000 - 49,999 | 50,000 - 99,999 | 100,000+ | ||
| Candidates tot. | 100.0 | 100.0 | 100.0 | 100.0 | 100.0 | 100.0 | 100.0 | 100.0 |
| National Coalition Pty KOK |
18.5 | 19.0 | 15.7 | 17.4 | 20.1 | 20.0 | 22.3 | 15.9 |
| Finnish Social Democratic Pty SDP |
18.8 | 12.6 | 14.9 | 18.1 | 20.5 | 22.3 | 21.8 | 15.9 |
| True Finns PS |
11.8 | 13.3 | 13.8 | 11.0 | 12.6 | 10.7 | 10.8 | 12.2 |
| Centre Pty of Finland CENT |
22.6 | 39.1 | 39.1 | 29.1 | 23.1 | 14.8 | 16.4 | 10.9 |
| Green League GREENS |
6.2 | 1.5 | 1.6 | 2.9 | 4.3 | 8.1 | 8.5 | 13.3 |
| Left Alliance LEFT |
9.4 | 6.4 | 6.4 | 9.8 | 7.9 | 11.0 | 8.7 | 12.5 |
| Swedish People's Pty in Finland RKP |
3.6 | 1.9 | 1.6 | 5.2 | 4.6 | 3.0 | 1.9 | 4.9 |
| Christian Democrats in Finland KD |
5.0 | 3.1 | 4.2 | 3.6 | 5.1 | 5.8 | 6.2 | 5.9 |
| Communist Pty of Finland SKP |
0.8 | 0.0 | 0.1 | 0.1 | 0.3 | 1.1 | 0.3 | 3.0 |
| Others | 3.1 | 3.0 | 2.5 | 2.8 | 1.6 | 3.1 | 3.2 | 5.5 |
In small municipalities the Centre Party has the highest number of candidates. The Centre Party candidates dominate municipalities with fewer than 20,000 inhabitants: in municipalities with fewer than 4,000 inhabitants nearly 40 per cent of all candidates were nominated by the Centre Party. In municipalities with 5,000 to 9,999 inhabitants, the proportion of the Centre Party is 29 per cent and in municipalities with 10,000 to 19,999 inhabitants it is 23 per cent of the candidates. In large municipalities with over 100,000 inhabitants the proportion of the Centre Party is slightly over ten per cent of all candidates. (Table 5.)
In larger municipalities no party reaches as large a share of the candidates as the Centre Party does in small municipalities. In municipalities with 20,000 to 99,999 inhabitants, around one fifth of all candidates are from both the Coalition Party and the Social Democratic Party. In the largest municipalities with over 100,000 inhabitants the distribution of candidates is considerably more even: the Coalition Party and the Social Democratic Party have nominated the most candidates, that is, both parties have a proportion of 16 per cent. Large cities also have more than average candidates from the Green League, the Left Alliance and the Communist Party of Finland. The share of True Finn candidates does not vary much by size of municipality.
1.3. Few candidates of foreign origin – and even fewer elected councillors
The language distribution among the candidates mirrors, by and large, the language distribution of the population in the regions. The proportion of Swedish-speaking candidates (5.3%) slightly exceeds their proportion of persons entitled to vote (4.9%). Swedish-speaking people are more active in the region of Uusimaa, where their proportion of the candidates is 14 per cent and that of the persons entitled to vote is 8.5 per cent. In the Greater Helsinki region the share of Swedish-speaking population in candidates is below their share of the population, however (5.9 per cent of the candidates and 11.5 per cent of persons entitled to vote). (Table 6.)
Table 6. Persons entitled to vote, candidates and councillors by native language by region in Municipal elections 2012, %
| Region | Persons entitled to vote |
Candidates | Councillors | ||||||
| Finnish/ Sami |
Swedish | Other | Finnish/ Sami |
Swedish | Other | Finnish/ Sami |
Swedish | Other | |
| MAINLAND FINLAND |
91.0 | 4.9 | 4.1 | 92.8 | 5.3 | 1.8 | 93.1 | 6.4 | 0.4 |
| Uusimaa | 83.4 | 8.5 | 8.0 | 82.7 | 14.1 | 3.3 | 79.8 | 19.4 | 0.9 |
| - Greater
Helsinki region |
84.0 | 5.9 | 10.1 | 83.1 | 11.5 | 5.5 | 83.2 | 14.1 | 2.7 |
| Varsinais-Suomi | 90.1 | 5.7 | 4.2 | 92.6 | 5.9 | 1.5 | 92.9 | 6.4 | 0.7 |
| Satakunta | 97.9 | 0.3 | 1.7 | 98.9 | 0.0 | 1.0 | 99.6 | 0.2 | 0.2 |
| Kanta-Häme | 97.4 | 0.4 | 2.3 | 98.7 | 0.3 | 1.0 | 99.5 | 0.3 | 0.3 |
| Pirkanmaa | 96.6 | 0.3 | 3.1 | 98.3 | 0.3 | 1.4 | 99.4 | 0.2 | 0.4 |
| Päijät-Häme | 96.5 | 0.3 | 3.2 | 97.8 | 0.2 | 2.0 | 99.2 | 0.0 | 0.8 |
| Kymen- laakso |
95.4 | 0.8 | 3.8 | 95.9 | 1.6 | 2.4 | 97.2 | 2.8 | 0.0 |
| South Karelia | 96.2 | 0.2 | 3.6 | 98.3 | 0.1 | 1.6 | 100.0 | 0.0 | 0.0 |
| Etelä Savo | 98.0 | 0.2 | 1.9 | 98.2 | 0.3 | 1.5 | 99.3 | 0.3 | 0.5 |
| Pohjois Savo | 98.3 | 0.1 | 1.6 | 97.9 | 0.2 | 1.9 | 99.5 | 0.3 | 0.2 |
| North Karelia | 97.6 | 0.1 | 2.3 | 97.5 | 0.2 | 2.3 | 98.8 | 0.5 | 0.7 |
| Central Finland | 97.8 | 0.2 | 2.1 | 98.5 | 0.2 | 1.3 | 99.5 | 0.0 | 0.5 |
| South Ostrobothnia |
98.4 | 0.3 | 1.3 | 98.9 | 0.2 | 0.9 | 99.8 | 0.0 | 0.2 |
| Ostrobothnia | 46.4 | 50.2 | 3.6 | 47.6 | 49.1 | 3.4 | 33.5 | 65.8 | 0.6 |
| Central Ostrobothnia |
88.9 | 9.5 | 1.6 | 91.1 | 7.6 | 1.3 | 95.0 | 5.0 | 0.0 |
| North Ostrobothnia |
98.3 | 0.2 | 1.6 | 98.5 | 0.4 | 1.1 | 99.4 | 0.1 | 0.5 |
| Kainuu | 98.2 | 0.1 | 1.7 | 98.0 | 0.3 | 1.8 | 99.6 | 0.0 | 0.4 |
| Lapland | 98.2 | 0.2 | 1.6 | 98.8 | 0.1 | 1.1 | 99.7 | 0.2 | 0.2 |
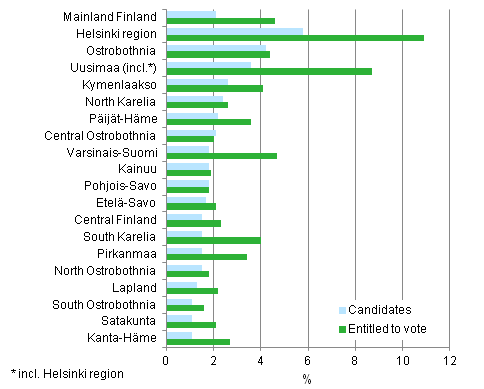
In all, 4.1 per cent of all persons entitled to vote speak another language than Finland's national languages. Considerably fewer of the candidates, just 1.8 per cent are foreign-language speakers. In nearly all regions the share of foreign-language speakers in all candidates is lower than their share of the population. Only in Pohjois-Savo, North Karelia and Kainuu the ratio of foreign-language speaking candidates is equal to or higher than that of persons entitled to vote. In the 2008 elections foreign-language speaking candidates made up 1.4 per cent of all candidates.
Of national language speakers, Sami speakers were nominated as candidates more than average. Of Sami speakers entitled to vote, 2.6 per cent were nominated in the Municipal elections. On average, 0.9 per cent of the persons entitled to vote are candidates. (Table 7.)
The nomination of foreign-language speakers as candidates is much rarer. On average, 0.4 per cent of foreign-language speakers entitled to vote are candidates in the Municipal elections. A total of 680 foreign-language speakers were nominated as candidates. It is 0.4 per cent of the foreign-language speakers entitled to vote. The largest group of foreign-language speaking candidates is formed by Russians, 172 candidates, and the second largest by Estonians, 66 candidates.
From 2008, the number of foreign-language speaking candidates has risen by 141. In 2008, foreign-language speaking candidates had the same share of foreign-language speakers entitled to vote as in the 2012 elections.
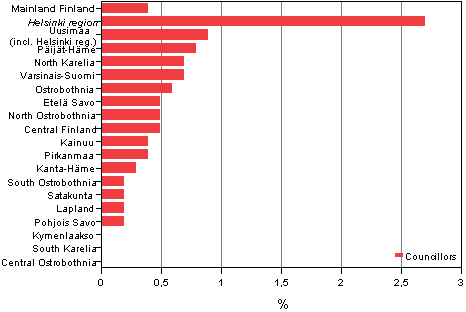
The number of elected councillors speaking other than national languages (Finnish, Swedish, Sami) was 43. They accounted for 0.4 per cent of the elected councillors. It was 0.1 percentage points more than in the 2008 elections. The number of Swedish-speakers is 622 and that of Sami-speakers 16.
In Uusimaa, especially in municipalities in Greater Helsinki, the number of elected foreign-language speakers was highest. In some regions no foreign-language speaking candidates were elected.
Table 7. Persons entitled to vote, candidates and councillors by native language, largest language groups specified, in Municipal elections 2012, %
| Language | Persons entitled to vote |
Candidates | % | Councillors |
| Languages tot. | 4,307,884 | 37,125 | 0.9 | 9,674 |
| Finnish | 3,918,154 | 34,428 | 0.9 | 8,993 |
| Swedish | 209,984 | 1,980 | 0.9 | 622 |
| Sami | 1,419 | 37 | 2.6 | 16 |
| Foreign- language speakers tot. |
178,327 | 680 | 0.4 | 43 |
| Russian | 44,832 | 172 | 0.4 | .. |
| Estonian | 26,584 | 66 | 0.2 | .. |
| English | 10,607 | 34 | 0.3 | .. |
| Somali | 7,221 | 29 | 0.4 | .. |
| Arabic | 7,183 | 42 | 0.6 | .. |
| Kurdish | 5,715 | 34 | 0.6 | .. |
| German | 4,790 | 20 | 0.4 | .. |
| Albanian | 4,574 | 18 | 0.4 | .. |
| Turkish | 4,264 | 38 | 0.9 | .. |
| Spanish | 3,972 | 28 | 0.7 | .. |
| Persian | 3,648 | 16 | 0.4 | .. |
| French | 2,470 | 10 | 0.4 | .. |
| Hungarian | 1,749 | 11 | 0.6 | .. |
| Serbo-Croat | 1,187 | 10 | 0.8 | .. |
The deficit of foreign persons among all candidates is 2.3 percentage points. In Uusimaa it is 4.7 and in Varsinais-Suomi 2.7 percentage points. The number of candidates of foreign background is thus smaller than their share of the population. The two exceptions are PohjoisNorth Savo and Kainuu, where the number of candidates of foreign background slightly exceeds their share of the population. The deficit is highest in areas where the population share of foreign-language speakers is largest, i.e. in Uusimaa - especially in the Greater Helsinki region - and in Varsinais-Suomi. (Figure 9.)
Figure 9. Share of foreign-language speakers by region among persons entitled to vote and candidates in Municipal elections 2012, %
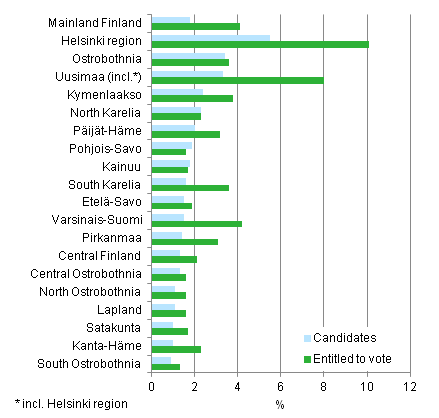
Figure 10. Share of foreign-language speakers by region among elected councillors in Municipal elections 2012, %
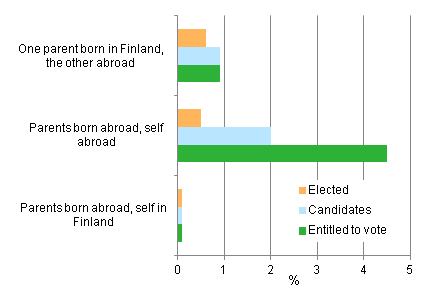
The foreign background of the population can also be examined by the person's origin. For 94.5 per cent of the persons entitled to vote and for 97.1 per cent of the candidates born in Finland both of their parents were also born in Finland. Thus, good five per cent of the persons entitled to vote and nearly three per cent of the candidates have some type of foreign background (Figure 11). Around one per cent of both persons entitled to vote and candidates have one parent born in Finland and the other abroad.
Second generation immigrants, or those who were themselves born in Finland, but whose parents were born abroad, are still fairly few among both persons entitled to vote and candidates (0.1%). First generation immigrants (the person and parents both born abroad) are clearly under-represented among the candidates. Of all persons entitled to vote, 4.5 per cent belong to this group, while this is so for only 2.0 per cent of the candidates.
For nearly 99 per cent of the elected councillors born in Finland both of their parents were also born in Finland. Persons whose one parent was born in Finland and the other abroad make up 0.6 per cent of the elected councillors. Thus, around half a per cent of the elected are of foreign background by their origin. Of the elected councillors, 0.1 per cent are second generation immigrants, that is, the same figure as among the candidates and persons entitled to vote. In contrast, there are fewer first generation immigrants elected than among the candidates or persons entitled to vote. (Figures 11 and 12.)
Figure 11. Proportion of persons with foreign background (persons whose at least one parent is born abroad) among persons entitled to vote, candidates and elected councillors in Municipal elections 2012, %
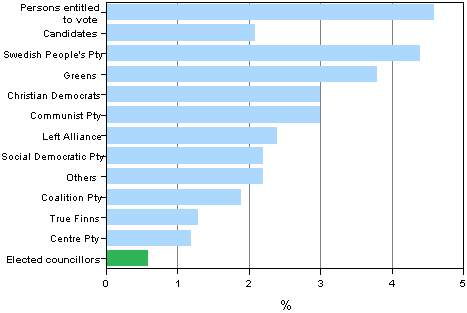
In the following examination, persons whose both parents (or only) were born abroad (first and second generation immigrants) are regarded as persons with foreign background. Of all candidates, 2.1 per cent belong to this group and 4.6 per cent of the persons entitled to vote. Examined by party, the number of candidates with foreign background is highest in the Swedish People's Party, 4.4 per cent of the candidates, and lowest in the True Finns (1.3%) and the Centre Party (1.2%). The Greens, the Christian Democrats, the Communist Party, the Left Alliance and the Social Democratic Party have more than average candidates with foreign background. (Figure 12.)
Figure 12. Proportion of persons with foreign background (persons whose at least one parent is born abroad) among persons entitled to vote, candidates by party and elected councillors in Municipal elections 2012, %
Uusimaa has the most persons entitled to vote who have foreign background, especially in the Greater Helsinki region, as has Varsinais-Suomi and Ostrobothnia, where in all the share of foreign-background persons is more than or close to the average for Mainland Finland. South and North Ostrobothnia, Pohjois-Savo and Kainuu have the lowest proportion of persons entitled to vote with foreign background, where under two per cent of the voters have foreign background. (Figure 13).
With regard to their share of the population, candidates with foreign background are clearly under-represented in South Karelia, Varsinais-Suomi, Kanta-Häme, Uusimaa and Pirkanmaa, where the proportion of the candidates is less than one half of that of persons entitled to vote. In contrast, the ratio of candidates with foreign background is almost equal to persons entitled to vote in Central Ostrobothnia, Pohjois-Savo, North Karelia and Kainuu. In Central Ostrobothnia even slightly more candidates have foreign background than persons entitled to vote do.
Figure 13. Proportion of persons with foreign background (persons whose both parents are born abroad) among persons entitled to vote and candidates by region, the Greater Helsinki region separately, in Municipal elections 2012, %
1.4. Educational level of the candidates and elected councillors high
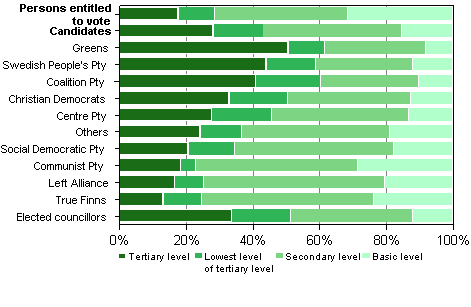
As regards education, candidates differ clearly from persons entitled to vote. Of the candidates, 84.5 per cent have attained a higher educational level than the basic level, while 68.5 per cent of all persons entitled to vote have some post-basic level education. Of persons entitled to vote, 28.4 per cent have at least lowest level tertiary education and of the candidates this is so for 43 per cent. (Figure 14.)
The educational level is highest for the Green League candidates. One half of them have tertiary level qualifications (ISCED 5A/6), while this is so for under 30 per cent of all candidates and for under one fifth of all persons entitled to vote. Swedish People's Party, Coalition Party and Christian Democrat candidates also have more tertiary level qualifications than average for the candidates.
The educational level of the elected councillors is higher than that of those entitled to vote and those nominated as candidates. One-third of the elected councillors have tertiary level qualifications and 17 per cent lowest level tertiary qualifications. Thus, one half of the elected councillors have tertiary level degrees. Of the candidates 43 per cent have tertiary level degrees and this is so for around 28 per cent of persons entitled to vote.
Of the elected councillors the Greens have the highest educational level: over 70 per cent have tertiary level qualifications. Nearly one half of those elected from the Coalition Party have tertiary level qualifications (48.5%). The number of those with tertiary level qualifications is lowest among the councillors elected from the True Finns (20.1%) and the Left Alliance (24.4%).
Figure 14. Persons entitled to vote, candidates (by party) and elected councillors by educational level in Municipal elections 2012, %
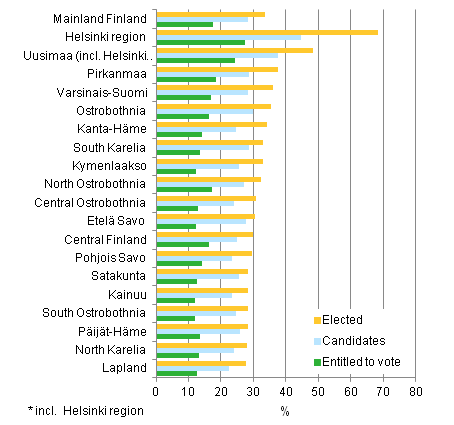
The educational level of the Municipal election candidates reflects the differences in the educational structure of different areas. In the region of Uusimaa and especially in the Greater Helsinki region the proportion of highly educated is higher than in the rest of country both among the persons entitled to vote and the candidates (Figure 11). In Uusimaa and particularly in the Greater Helsinki region the proportion of highly educated candidates is considerable. In the Greater Helsinki region, nearly 45 per cent and in the whole Uusimaa region around 38 per cent of the candidates have tertiary level qualifications (ISCED 5A/6). In other areas at most 30 per cent of the candidates have tertiary level qualifications (ISCED 5A/6).
Table 8. Persons entitled to vote, candidates (by party) and elected councillors by educational level in Municipal elections 2012, %
| Tertiary level (ISCED 5A/6) |
Lowest tertiary (ISCED 5B) |
Secondary level (ISCED 3/4) |
Basic level |
|
| Persons entitled to vote |
17.7 | 10.8 | 40.1 | 31.5 |
| Candidates | 28.2 | 14.9 | 41.5 | 15.5 |
| Green League GREENS |
50.7 | 10.7 | 30.3 | 8.3 |
| Swedish People's Pty in Finland RKP |
44.1 | 14.7 | 29.0 | 12.2 |
| National Coalition Pty KOK |
41.0 | 19.3 | 29.5 | 10.3 |
| Christian Democrats in Finland KD |
32.9 | 17.5 | 36.9 | 12.7 |
| Centre Pty of Finland CENT |
27.6 | 18.0 | 41.0 | 13.3 |
| Others | 24.2 | 12.5 | 44.4 | 18.9 |
| Finnish Social Democrats in Finland SDP |
20.7 | 13.7 | 47.8 | 17.8 |
| Communist Pty of Finland SKP |
18.4 | 4.3 | 48.7 | 28.6 |
| Left Alliance LEFT |
16.6 | 8.6 | 54.2 | 20.6 |
| True Finns PS |
13.2 | 11.3 | 51.6 | 23.9 |
| Elected councillors |
33.7 | 17.6 | 36.5 | 12.2 |
In regions where persons entitled to vote have the least often tertiary level educational qualifications, the number of candidates with tertiary level qualifications is in relative terms the highest. For instance, in Etelä-Savo, South Karelia, Kymenlaakso, South Ostrobothnia and Satakunta, the proportion of candidates with tertiary level qualifications is double that of persons entitled to vote. In the Greater Helsinki region and Uusimaa the ratio is around one-and-a-half times as high.
By region, the educational level is highest for the councillors elected in Uusimaa, and especially in the municipalities in the Greater Helsinki region. Of those elected in Uusimaa, nearly one half have tertiary level qualifications and this is so for almost 70 per cent of those elected in the Greater Helsinki region.
Figure 15. Proportion of persons with tertiary level qualifications among persons entitled to vote, candidates and elected councillors by region in Municipal elections 2012, %
1.5. Family status
Majority of candidates and elected councillors live in families with childrenThe candidates also differ in their family status from the persons entitled to vote: considerably more (36%) of them are parents of a family with children and fewer of them are without a family (20%) than is the case among persons entitled to vote (24% and 30%). Fewer of the candidates are young people living at home. Differences in the family status are explained by the fact that the age structure of the candidates and persons entitled to vote differs from each other. Both the bottom and top ends of the age range are missing among the candidates. For a majority of those entitled to vote children have already moved from home, while most candidates are at an age when children are still living at home. (Figure 16, table 9.)
Of all persons entitled to vote around one quarter are parents of a family with children, or the family has at least one underage child. Nearly three per cent of them are single parents. In addition, around eight per cent are parents with adult children living at home. Approximately 33 per cent are childless couples, close on 30 per cent live alone without a family and around seven per cent of persons entitled to vote are young adults living at home.
The proportion of candidates whose children are still living at home is highest for the Centre Party and Swedish People's Party candidates, being over one half of these parties' candidates. In turn, the Communist Party and Left Alliance candidates have the least often children living in their household. Young people living at home are the most common among the Centre Party and Coalition Party candidates and persons without a family among the Communist Party (43%) and Green League candidates (25%). Only the Communist Party of Finland has more candidates without a family than is the case for all persons entitled to vote.
In their family status the elected councillors differ clearly from those entitled to vote. Of the elected councillors, 41.3 per cent are parents of families with children. The respective percentage among the persons entitled to vote is 24. Parents with only adult children living at home are also more numerous among the elected councillors than among persons entitled to vote. Considerably fewer of the elected councillors are without a family, only 12.2 per cent, while around 30 per cent of persons entitled to vote belong to this group.
Figure 16. Persons entitled to vote, candidates (by party) and elected councillors by family type in Municipal elections 2012, %
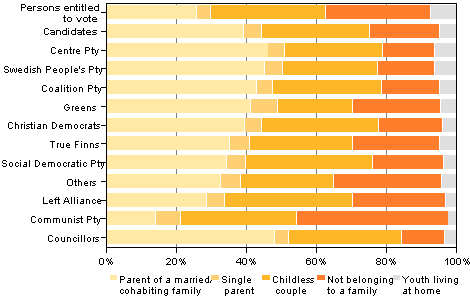
Table 9. Persons entitled to vote and candidates (by party) and elected councillors by family status in Municipal elections 2012, %
| Party | Families with
children (aged under 18) |
Other families with
only children aged 17 or over |
Childless couple |
Youth living at home |
Not belonging to a family |
||
| Parent of a married/ cohabiting family |
Single parent |
Parent of a married/ cohabiting family |
Single parent |
||||
| Persons entitled to vote |
21.3 | 2.7 | 4.5 | 1.4 | 32.9 | 7.3 | 29.9 |
| Candidates | 32.4 | 3.9 | 6.8 | 1.4 | 30.8 | 4.6 | 20.1 |
| National Coalition Pty KOK |
36.7 | 3.6 | 6.2 | 1.1 | 31.0 | 4.7 | 16.7 |
| Finnish Social Democratic Pty SDP |
27.5 | 3.9 | 7.0 | 1.5 | 36.1 | 3.5 | 20.4 |
| True Finns PS |
30.5 | 4.3 | 4.9 | 1.4 | 29.3 | 4.7 | 24.9 |
| Centre Pty of Finland CENT |
37.3 | 3.4 | 9.0 | 1.4 | 27.9 | 6.2 | 14.8 |
| Green League GREENS |
38.2 | 6.6 | 3.0 | 1.2 | 21.4 | 4.3 | 25.3 |
| Left Alliance LEFT |
22.2 | 3.7 | 6.5 | 1.6 | 36.5 | 2.9 | 26.6 |
| Swedish People's Pty in Finland RKP |
36.6 | 3.7 | 8.8 | 1.4 | 27.1 | 6.3 | 16.1 |
| Christian Democrats in Finland KD |
31.3 | 3.8 | 8.4 | 1.0 | 33.4 | 3.8 | 18.2 |
| Communist Pty of Finland SKP |
11.2 | 5.6 | 3.0 | 1.6 | 33.2 | 2.3 | 43.1 |
| Others | 27.7 | 4.6 | 5.0 | 1.3 | 26.4 | 4.1 | 30.9 |
| Elected councillors |
38.5 | 2.8 | 9.6 | 1.3 | 32.3 | 3.4 | 12.2 |
1.6. Number of children
More children than on averageFamily status does not reveal how many of the candidates have or have had children of their own, because in older families, children may have already moved away from home and in family break-ups, children may live with their other parent. Information on the number of children can be regarded as an indicator of how many have experiences of children of their own.
Candidates have more children than average. Of the candidates, 78 per cent have children of their own, whereas the corresponding figure for persons entitled to vote is 65 per cent. Children are the most numerous among the Christian Democrats, of whom 22 per cent have at least four children, and among the Centre Party candidates, of whom 17 per cent have four or more children. Large families are rarer for the Communist Party and Green League candidates (Figure 13). The candidates’ number of children reflects the birth rate in the area, which means that the number of children is highest in North, Central and South Ostrobothnia, Kainuu and Lapland, and lowest in Varsinais-Suomi, Uusimaa, Kymenlaakso and South Karelia. (Figure 17.)
In all, 35 per cent of the persons entitled to vote and 22 per cent of the candidates have never had children of their own. The proportion of childless candidates varies from 19 per cent for the Social Democrats to 31 per cent for the Green League.
Figure 17. Persons entitled to vote, candidates (by party) and elected councillors by number of children in Municipal elections 2012, %
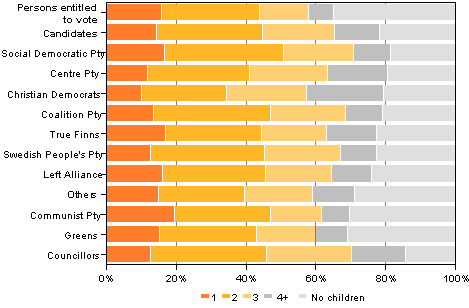
The candidates have two children, on average. All persons entitled to vote have an average of 1.5 children. The number of children is highest among the Christian Democrat candidates, i.e. 2.3 children and lowest among the Communist Party candidates, 1.6 children. Men entitled to vote have slightly fewer children than women, but there is not much of a difference between genders among the candidates. (Table 10.)
Elected councillors have more children than those entitled to vote and candidates, on average. Only 14 per cent of the candidates are entirely without children, while around one-third of persons entitled to vote and about one-fifth of candidates do not have or have not had children. Elected councillors have an average of 2.3 children. The number of children is highest among the elected Christian Democrats, i.e. 3.1 children and lowest among the elected Communist Party councillors, 1.9 children. Around 16 per cent of the elected councillors have at least four children, while this is so for only 7.3 per cent of persons entitled to vote.
Table 10. Persons entitled to vote, candidates and elected councillors by number of children (children on average) in Municipal elections 2012
| Total | Men | Women | ||||
| Persons entitled to vote |
1.5 | 1.4 | 1.6 | |||
| Party | Candidates | Councillors | Candidates | Councillors | Candidates | Councillors |
| Total | 2.0 | 2.3 | 2.0 | 2.3 | 2.0 | 2.2 |
| National Coalition Pty KOK |
2.0 | 2.2 | 2.0 | 2.2 | 1.9 | 2.2 |
| Finnish Social Democratic Pty SDP |
1.9 | 2.1 | 1.9 | 2.1 | 2.0 | 2.1 |
| True Finns PS |
1.9 | 2.1 | 1.9 | 2.1 | 2.1 | 2.2 |
| Centre Pty of Finland CENT |
2.3 | 2.6 | 2.3 | 2.7 | 2.3 | 2.5 |
| Green League GREENS |
1.6 | 1.9 | 1.5 | 1.8 | 1.7 | 2.0 |
| Left Alliance LEFT |
1.8 | 2.1 | 1.8 | 2.2 | 1.9 | 2.0 |
| Swedish People's Pty in Finland RKP |
1.9 | 2.1 | 1.9 | 2.0 | 1.9 | 2.1 |
| Christian Democrats in Finland KD |
2.3 | 3.1 | 2.3 | 3.2 | 2.3 | 2.9 |
| Communist Pty of Finland SKP |
1.6 | .. | 1.6 | .. | 1.6 | .. |
| Others | 1.8 | 2.3 | 1.6 | 2.4 | 2.0 | 2.2 |
1.7. Employment status
Employment problems rareSeventy-one per cent of the candidates are employed, and the proportion of unemployed persons is more or less the same as among persons entitled to vote. In turn, there are clearly fewer pensioners among the candidates, just 16 per cent. However, there are nearly three percentage points more pensioner candidates than in the previous Municipal elections. When looking at working-age population (aged 18 to 64), 78 per cent of the candidates are employed, while the proportion of employed persons is ten percentage points lower among all persons entitled to vote. Distinctly more of the persons entitled to vote of this age are students and other inactive population than among the candidates. (Figure 18, table 11.)
Over one half, around 54 per cent, of persons entitled to vote, are working, six per cent are unemployed and around 28 per cent are pensioners. Eight per cent of persons entitled to vote are studying and around four per cent are otherwise in inactive population. The proportion of the employed has fallen somewhat and that of the unemployed has risen slightly from the previous elections.
The number of employed persons is highest among the Swedish People's Party, Coalition Party and Centre Party candidates, of whom over 75 per cent are working. In these parties unemployment is rarer than average. Among the candidates of the Social Democratic Party, the Green League and the Christian Democrats unemployment is as common as among the persons entitled to vote, whereas the candidates of the Left Alliance, the True Finns and the Communist Party have been unemployed more often than average. The Green League has in relative terms the highest proportion of student candidates, 11.8 per cent. The proportion of pensioners is highest for the Communist Party of Finland, which explains the small share of employed persons among the Communist Party candidates.
Around 80 per cent of those elected to municipal councils are employed persons. Of the elected councillors, 13.2 per cent are pensioners. When examining the population of working age (aged 18 to 64) the employment of elected councillors is even higher. As many as 87.5 per cent of the elected councillors in these age groups are employed persons. This is so for under 70 per cent of persons entitled to vote of same age and for nearly 80 per cent of the candidates.
Figure 18. Persons entitled to vote, candidates (by party) and elected councillors by main type of activity in Municipal elections 2012, %
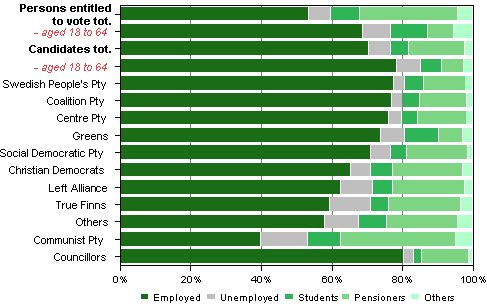
Table 11. Persons entitled to vote, candidates (by party) and elected councillors by main type of activity in Municipal elections 2012, %
| Employed | Unemployed | Students | Pensioners | Others | |
| Persons entitled to vote, tot. |
53.6 | 6.2 | 8.1 | 27.9 | 4.3 |
| - aged 18 to 64 | 68.7 | 8.0 | 10.5 | 7.3 | 5.5 |
| Candidates, tot. | 70.6 | 6.0 | 5.3 | 15.8 | 2.3 |
| - aged 18 to 64 | 78.3 | 6.8 | 6.0 | 6.2 | 2.6 |
| Swedish People's Pty in Finland RKP |
77.7 | 2.9 | 5.5 | 11.7 | 2.2 |
| National Coalition Pty KOK |
77.0 | 3.2 | 4.8 | 13.2 | 1.8 |
| Centre Pty of Finland CENT |
76.2 | 3.7 | 4.5 | 13.7 | 1.9 |
| Green League GREENS |
73.9 | 6.9 | 9.4 | 7.0 | 2.8 |
| Finnish Social Democratic Pty SDP |
71.0 | 5.7 | 4.5 | 17.3 | 1.5 |
| Christian Democrats in Finland KD |
65.3 | 5.8 | 6.1 | 19.8 | 3.0 |
| Left Alliance LEFT |
62.5 | 9.0 | 5.7 | 20.4 | 2.4 |
| True Finns PS |
59.5 | 11.5 | 5.2 | 20.2 | 3.6 |
| Others | 58.1 | 9.6 | 8.0 | 20.0 | 4.3 |
| Communist Pty of Finland SKP |
39.8 | 13.5 | 9.2 | 32.6 | 4.9 |
| Councillors | 80.3 | 2.8 | 2.4 | 13.2 | 1.3 |
The employment rate is calculated as the ratio of employed persons aged 18 to 64 to the population of the same age. The employment rates of the candidates closely resemble those of persons entitled to vote. Where the employment rate of total population is high, the employment rate of the candidates is also at a high level there. Ostrobothnia has the highest employment rate of total population, 73.4 per cent, and there over 82 per cent of the candidates are working. Correspondingly, the general employment rate in North Karelia is 62 per cent and the employment of the candidates is also lowest, around 72 per cent are employed. (Figure 19, table 12.)
The employment rate of the candidates is closest to those entitled to vote in Uusimaa, where the employment rate of the candidates is 6.9 percentage points higher than that of persons entitled to vote. The difference between employment rates is largest in Satakunta, that is, 12.9 percentage points. There the employment rate of the candidates is 81.1 per cent and that of persons entitled to vote 68.2 per cent.
The employment rate of the elected councillors is highest in Varsinais-Suomi, South Ostrobothnia and Ostrobothnia, where in all the employment rate is over 90 per cent. The employment rates are lowest for councillors elected in Lapland and North Karelia, around 80 per cent, but even that is considerably higher than among persons entitled to vote in the best region.
Figure 19. Employment rate of persons entitled to vote, candidates and elected councillors (aged 18 to 64) by region in Municipal elections 2012, %
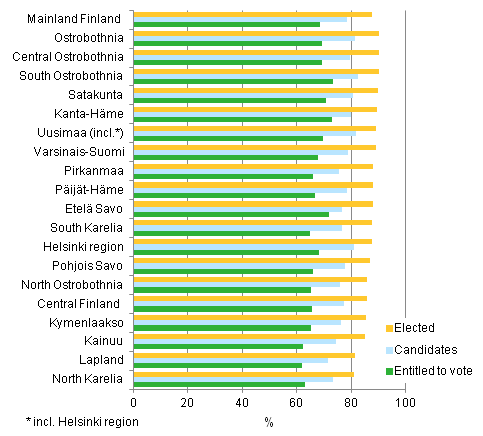
Table 12. Employment rate of persons entitled to vote, candidates and elected councillors (aged 18 to 64) by region in Municipal elections 2012, %
| Region | Both sexes | Men | Women | ||||||
| Persons entitled to vote |
Candidates | Councillors | Persons entitled to vote |
Candidates | Councillors | Persons entitled to vote |
Candidates | Councillors | |
| Mainland Finalnd |
68.7 | 78.3 | 87.5 | 67.6 | 77.3 | 86.7 | 69.8 | 79.9 | 88.7 |
| Uusimaa | 72.9 | 79.8 | 89.5 | 71.7 | 79.1 | 88.1 | 74.0 | 80.6 | 91.2 |
| Greater Helsinki region |
72.0 | 76.8 | 87.9 | 70.5 | 76.0 | 87.5 | 73.4 | 77.9 | 88.2 |
| Varsinais-Suomi | 69.1 | 79.5 | 90.5 | 67.7 | 78.0 | 89.5 | 70.5 | 81.5 | 92.1 |
| Satakunta | 68.2 | 81.1 | 87.6 | 67.6 | 78.7 | 85.2 | 68.8 | 84.7 | 92.3 |
| Kanta-Häme | 70.7 | 80.8 | 89.4 | 69.9 | 80.1 | 89.6 | 71.6 | 81.7 | 89.1 |
| Pirkanmaa | 67.7 | 78.9 | 89.2 | 66.8 | 79.3 | 90.1 | 68.6 | 78.3 | 87.6 |
| Päijät-Häme | 66.7 | 78.5 | 88.0 | 66.2 | 78.5 | 86.5 | 67.2 | 78.5 | 90.4 |
| Kymenlaakso | 65.8 | 75.7 | 87.7 | 64.5 | 73.0 | 86.5 | 67.1 | 79.7 | 89.5 |
| South Karelia |
65.5 | 77.4 | 85.7 | 63.9 | 74.9 | 85.3 | 67.2 | 81.3 | 86.4 |
| Etelä Savo |
65.9 | 77.6 | 87.0 | 64.0 | 76.6 | 87.1 | 67.8 | 79.1 | 86.8 |
| Pohjois Savo |
64.9 | 76.6 | 87.7 | 63.4 | 74.7 | 86.3 | 66.4 | 79.4 | 89.9 |
| North Karelia |
62.0 | 71.6 | 81.7 | 60.6 | 70.9 | 79.8 | 63.6 | 72.8 | 84.8 |
| Central Finland |
65.3 | 75.9 | 85.5 | 64.7 | 76.0 | 83.9 | 66.0 | 75.6 | 87.9 |
| South Ostrobothnia |
69.3 | 81.5 | 90.2 | 69.4 | 80.2 | 90.3 | 69.3 | 83.6 | 90.1 |
| Ostrobothnia | 73.4 | 82.4 | 90.4 | 73.2 | 80.7 | 89.1 | 73.7 | 85.0 | 92.4 |
| Central Ostrobothnia |
69.6 | 81.8 | 89.3 | 70.2 | 82.6 | 89.1 | 69.0 | 80.3 | 89.7 |
| North Ostrobothnia |
65.1 | 76.4 | 85.2 | 65.0 | 74.8 | 85.7 | 65.3 | 78.8 | 84.3 |
| Kainuu | 62.4 | 74.3 | 85.0 | 59.8 | 72.9 | 83.6 | 65.3 | 76.5 | 87.2 |
| Lapland | 62.9 | 73.2 | 80.8 | 61.1 | 71.5 | 80.7 | 64.8 | 75.6 | 80.9 |
Majority of candidates and one half of elected councillors are salaried employees
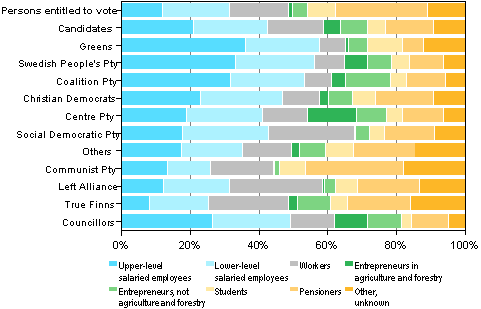
Over 40 per cent of all candidates are salaried employees and this is so for around 30 per cent of all persons entitled to vote. The proportion of salaried employees is highest among the Green League, Swedish People's Party and Coalition Party candidates, over one half of whom are upper-level or lower-level salaried employees. In all these the proportion of upper-level employees is over one half among all salaried employees. The proportion of salaried employees is lowest among the True Finns (8.3%), Left Alliance (12.4%) and Communist Party (13.5%) candidates. (Figure 20.)
The Coalition Party (14.2%) and Swedish People's Party (6.7%) candidates have the highest proportion of entrepreneurs in agriculture and forestry. The Coalition Party candidates have the biggest share of other entrepreneurs, or 13 per cent. The proportion of workers is highest among the Left Alliance and Social Democrat candidates, around one quarter, and among the True Finns, about 23 per cent.
Around one half of the elected councillors are salaried employees, about 12 per cent workers, and about 20 per cent entrepreneurs. The rest, around 20 per cent, are pensioners and students.
Figure 20. Persons entitled to vote, candidates (by party) and elected councillors by sosio-economic group in Municipal elections 2012, %
The public sector employs candidates more than persons entitled to vote
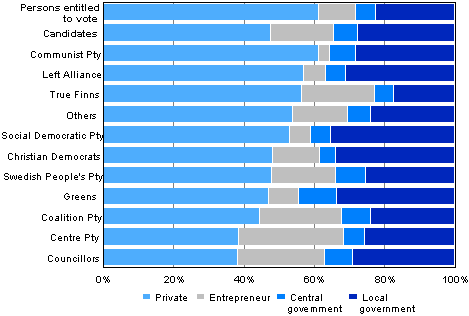
Of the candidates around 70 per cent are employed. Forty-eight per cent of them are private sector wage and salary earners, 18 per cent are entrepreneurs and seven per cent work for central government and 27 per cent for local government. Employer type varies significantly by party. The proportion of private sector wage and salary earners is highest among the Communist Party and Left Alliance candidates, or around 60 per cent, 56 per cent among the True Finn candidates and 53 per cent among the SDP candidates. The lowest proportion of private sector wage and salary earners was found among the Centre Party candidates (39%). It should, however, be noted that only one half of the Communist Party candidates are in working life and the rest are pensioners, unemployed, studying and so on.
Thirty per cent of the Centre Party candidates are entrepreneurs, the majority of whom work in agriculture. The lowest proportions of entrepreneurs can be found in the Communist Party of Finland (3.3%) and the Social Democratic Party (6.0%). Green League candidates are most often employed by the public sector: 34 per cent receive their pay from local government and 11 per cent from central government. The next highest proportion of public sector employees is found among the Social Democrats, of whom 35 per cent are employed by local and six per cent by central government. The proportion of public sector candidates is lowest for the True Finns: 17 per cent work in the local government sector and five per cent in the central government sector. (Figure 21.)
Around 80 per cent of the elected councillors are employed. Of them 28 per cent are private sector wage and salary earners. Thirty-seven per cent of the elected work in the public sector. The share of entrepreneurs among elected councillors (24.7%) is considerably higher than among employed persons entitled to vote (10.3%).
Figure 21. Persons entitled to vote, candidates (by party) and elected councillors by employer sector in Municipal elections 2012, %
The public sector employs candidates most in the largest municipalities, where almost 40 per cent are employed in the local or central government sector. In municipalities with fewer than 5,000 inhabitants the public sector has a share of 30 per cent and the private sector (incl. entrepreneurs) 70 per cent. In the smallest municipalities, entrepreneurs account for around one fifth of the candidates. (Table 13.)
The proportion of entrepreneurs among elected councillors is highest in municipalities with the lowest population. In municipalities with fewer than 2,000 inhabitants around 40 per cent of the elected councillors are entrepreneurs. In larger municipalities more public sector wage and salary earners were elected to councils. In municipalities with over 100,000 inhabitants more than one-fifth work in the central government sector and nearly 30 per cent in the local government sector.
Table 13. Persons entitled to vote, candidates and elected councillors by employer sector and size of municipality in Municipal elections 2012, %
| Size category of municipality |
Private | Entrepeneurs | Central government |
Local government |
Public total |
| Persons entitled to vote, tot. |
61.3 | 10.3 | 5.9 | 22.4 | 28.4 |
| -1,999 | 47.7 | 23.4 | 3.2 | 25.7 | 29.0 |
| 2,000-4,999 | 50.8 | 20.8 | 3.4 | 25.1 | 28.5 |
| 5,000-9,999 | 55.4 | 16.4 | 4.0 | 24.2 | 28.2 |
| 10,000-19,999 | 58.3 | 13.9 | 3.9 | 23.9 | 27.8 |
| 20,000-49,999 | 63.2 | 9.7 | 4.5 | 22.6 | 27.1 |
| 50,000-99,999 | 58.8 | 9.1 | 6.4 | 25.6 | 32.1 |
| 100,000+ | 65.3 | 6.8 | 8.0 | 20.0 | 27.9 |
| Candidates, tot. |
47.7 | 18.0 | 6.7 | 27.7 | 34.3 |
| -1,999 | 39.2 | 33.4 | 4.0 | 23.4 | 27.4 |
| 2,000-4,999 | 41.5 | 27.0 | 4.2 | 27.3 | 31.4 |
| 5,000-9,999 | 45.2 | 22.5 | 5.4 | 26.8 | 32.2 |
| 10,000-19,999 | 47.4 | 19.2 | 5.4 | 28.0 | 33.5 |
| 20,000-49,999 | 52.4 | 13.3 | 6.2 | 28.2 | 34.3 |
| 50,000-99,999 | 46.6 | 13.2 | 8.7 | 31.4 | 40.1 |
| 100,000+ | 52.8 | 9.2 | 11.8 | 26.1 | 37.9 |
| Councillors, tot. |
38.2 | 24.8 | 8.0 | 29.1 | 37.1 |
| -1,999 | 33.6 | 40.7 | 4.0 | 21.7 | 25.7 |
| 2,000-4,999 | 35.7 | 32.9 | 5.1 | 26.3 | 31.4 |
| 5,000-9,999 | 38.6 | 27.6 | 6.4 | 27.4 | 33.8 |
| 10,000-19,999 | 38.1 | 23.9 | 7.5 | 30.6 | 38.0 |
| 20,000-49,999 | 42.3 | 15.7 | 8.2 | 33.8 | 42.0 |
| 50,000-99,999 | 35.0 | 17.8 | 12.5 | 34.6 | 47.2 |
| 100,000+ | 40.6 | 8.9 | 22.9 | 27.6 | 50.5 |
1.8. Income level
Income level of the candidates and elected councillors higher than that of persons entitled to voteThe candidates are better educated and their employment rate is higher than that of persons entitled to vote in the area concerned. This partly explains why their income subject to state taxation is also clearly higher than that of persons entitled to vote. In the following, we examine the income level of the candidates and persons entitled to vote by means of median income.
In 2010 the median income of persons entitled to vote was EUR 21,500, and that of candidates EUR 29,900, that is, EUR 8,400 higher. Both the persons entitled to vote and the candidates had the highest income in the region of Uusimaa (EUR 25,000 and EUR 33,600, respectively). (Figure 22, table 14.)
At its largest the income differential between the candidates and persons entitled to vote is in Ostrobothnia, Etelä-Savo and Satakunta, where the median income of the candidates is over EUR 10,000 higher than that of persons entitled to vote. The income differential is smallest in North Karelia and Lapland, under EUR 8,000. The income subject to state taxation has risen since the last Municipal elections, by 13.7 per cent among persons entitled to vote and by 12.7 per cent among the candidates.
Persons entitled to vote have had the best income development compared with the 2008 Municipal elections in Kainuu and Lapland, where their median income has risen by over 17 per cent. The candidates' income has gone up most in Ostrobothnia, South Ostrobothnia and Uusimaa, that is, by at least 15 per cent. In contrast, the income of persons entitled to vote has risen least in Varsinais-Suomi (11.8%) and Uusimaa (12.3%). The income development of the candidates has been smallest in North Karelia, where the candidates' median income is around five per cent higher than during the previous Municipal elections.
The median income of elected councillors in 2010 was around EUR 37,000. Compared with those entitled to vote, their income was around 70 per cent and compared with the candidates, it was about 28 per cent higher. In euros the biggest differences in income subject to state taxation were for candidates and persons entitled to vote in Uusimaa, especially in the Greater Helsinki region, Kymenlaakso and South Karelia, where the median income of elected councillors is around EUR 20,000 higher than that of persons entitled to vote. Persons elected to municipal councils earn an average of EUR 15,000 more than persons entitled to vote.
Figure 22. Median income subject to state taxation (in euro) of persons entitled to vote, candidates and elected councillors by region in Municipal elections 2012,
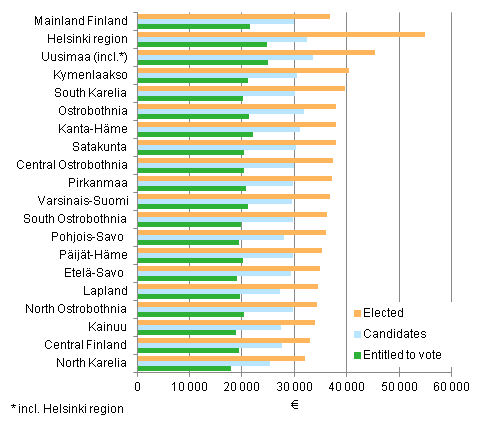
Table 14. Median income subject to state taxation (in euro) of persons entitled to vote, candidates and elected councillors by region in Municipal elections 2012, %
| Region | Persons entitled to vote |
Candidates | Councillors | ||||||
| Total | Men | Women | Total | Men | Women | Total | Men | Women | |
| Mainland Finland |
21,498 | 24,746 | 19,062 | 29,884 | 31,701 | 27,565 | 36,908 | 38,984 | 34,111 |
| Uusimaa | 24,976 | 28,393 | 22,625 | 33,608 | 36,111 | 30,447 | 45,502 | 49,570 | 40,822 |
| Greater Helsinki region |
24,793 | 27,809 | 22,761 | 32,463 | 34,432 | 30,484 | 54,987 | 61,869 | 48,809 |
| Varsinais-Suomi | 21,228 | 24,511 | 18,814 | 29,554 | 30,875 | 27,770 | 36,798 | 38,460 | 35,332 |
| Satakunta | 20,316 | 24,161 | 17,461 | 30,365 | 32,971 | 27,587 | 37,877 | 40,961 | 33,837 |
| Kanta-Häme | 22,076 | 25,547 | 19,496 | 31,060 | 33,366 | 28,506 | 37,888 | 39,380 | 36,156 |
| Pirkanmaa | 20,792 | 24,317 | 18,252 | 29,713 | 31,728 | 26,735 | 37,179 | 39,643 | 34,944 |
| Päijät-Häme | 20,244 | 23,665 | 17,771 | 29,657 | 31,400 | 26,605 | 35,356 | 40,207 | 32,598 |
| Kymenlaakso | 21,173 | 25,142 | 17,981 | 30,472 | 32,782 | 27,391 | 40,394 | 42,492 | 38,241 |
| South Karelia |
20,250 | 23,933 | 17,483 | 30,076 | 32,561 | 26,775 | 39,618 | 41,219 | 35,346 |
| Etelä Savo |
19,057 | 21,299 | 17,227 | 29,401 | 31,342 | 26,238 | 34,964 | 37,467 | 32,905 |
| Pohjois Savo |
19,469 | 22,003 | 17,565 | 28,073 | 28,909 | 27,179 | 36,128 | 35,563 | 36,217 |
| North Karelia |
17,905 | 20,037 | 16,205 | 25,338 | 26,790 | 23,606 | 32,003 | 33,139 | 30,474 |
| Central Finland |
19,511 | 22,854 | 17,068 | 27,562 | 29,682 | 23,631 | 32,923 | 34,078 | 29,864 |
| South Ostrobothnia |
19,718 | 22,724 | 17,340 | 29,684 | 30,823 | 27,877 | 36,335 | 37,346 | 34,068 |
| Ostrobothnia | 21,348 | 25,473 | 18,339 | 31,793 | 32,240 | 28,359 | 38,011 | 41,107 | 32,689 |
| Central Ostrobothnia |
20,468 | 24,591 | 17,381 | 29,852 | 32,362 | 26,707 | 37,410 | 38,869 | 33,374 |
| North Ostrobothnia |
20,478 | 23,872 | 17,826 | 29,741 | 30,971 | 28,391 | 34,346 | 36,348 | 32,088 |
| Kainuu | 18,875 | 21,306 | 16,889 | 27,440 | 28,013 | 25,896 | 34,022 | 36,363 | 32,485 |
| Lapland | 19,657 | 21,963 | 17,750 | 27,347 | 28,967 | 25,217 | 34,611 | 36,867 | 31,591 |
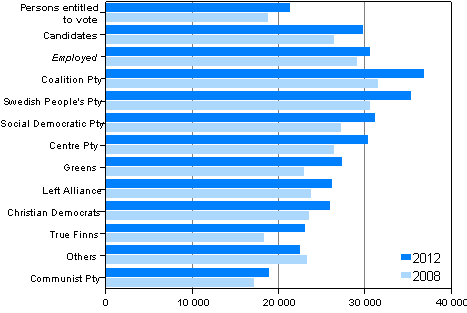
The candidates’ income varies by party from EUR 37,000 in the Coalition Party to EUR 19,000 in the Communist Party. The median income of the Swedish People's Party candidates is EUR 35,500, that of the SDP candidates EUR 31,300 and that of the Centre Party candidates EUR 30,500. Compared to persons entitled to vote, the Coalition Party and Swedish People’s Party candidates earn nearly EUR 15,000 more. The income of the Green League’s younger and often student candidates is, on average, EUR 2,300 higher than that of the persons entitled to vote. Only the income of the Communist Party candidates is lower than that of persons entitled to vote. (Figure 23, table 15.)
Figure 23. Median income subject to state taxation (in euro) of persons entitled to vote and candidates (by party) in Municipal elections 2012 and 2008
Of the elected councillors the income is highest in the Coalition Party, EUR 45,000, and lowest in the True Finns, EUR 29,000.
Figure 24. Median income subject to state taxation (in euro) of candidates and elected councillors (by party) in Municipal elections 2012
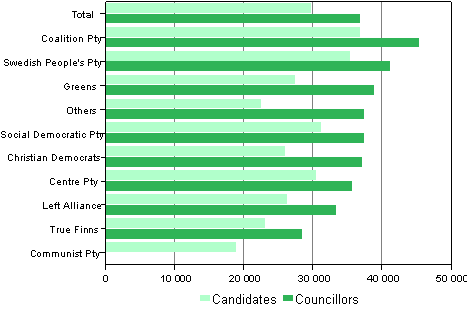
*For the Communist Party of Finland the income is masked (under ten elected councillors)
Table 15. Median income subject to state taxation (in euro) of persons entitled to vote, candidates and elected councillors (by party) in Municipal elections 2012
| Total | Men | Women | ||||
| Persons entitled to vote |
21,498 | 24,746 | 19,062 | |||
| Party | Candidates | Councillors | Candidates | Councillors | Candidates | Councillors |
| Total | 29,884 | 36,908 | 31,701 | 38,984 | 27,565 | 34,111 |
| National Coalition Pty KOK |
36,968 | 45,499 | 39,925 | 48,458 | 33,444 | 40,827 |
| Finnish Social Democratic Pty SDP |
31,254 | 37,468 | 33,222 | 39,630 | 28,636 | 35,356 |
| True Finns PS |
23,145 | 28,542 | 24,031 | 29,597 | 20,555 | 26,242 |
| Centre Pty of Finland CENT |
30,530 | 35,773 | 33,164 | 38,142 | 27,364 | 32,016 |
| Green League GREENS |
27,481 | 39,049 | 29,071 | 44,369 | 26,188 | 36,655 |
| Left Alliance LEFT |
26,328 | 33,475 | 28,130 | 35,027 | 24,063 | 30,108 |
| Swedish People's Pty in Finland RKP |
35,513 | 41,310 | 39,150 | 46,214 | 31,410 | 37,728 |
| Christian Democrats in Finland KD |
26,063 | 37,235 | 28,708 | 39,790 | 24,027 | 35,156 |
| Communist Pty of Finland SKP |
18,974 | .. | 20,421 | .. | 17,644 | .. |
| Others | 22,671 | 37,504 | 23,234 | 39,171 | 21,323 | 33,080 |
The median income of all candidates is nearly 40 per cent higher than that of persons entitled to vote. In comparison to persons entitled to vote, the income of the Coalition Party candidates is 72 per cent higher, that of the Swedish People's Party candidates 65 per cent, that of the SDP candidates 45 per cent and that of the Centre Party candidates 42 per cent. The income level of the True Finns is close to the income level of all persons entitled to vote, that is, just eight per cent higher. The income level of the Communist Party candidates is even lower than that of persons entitled to vote, or 88 per cent of that.
The differences are even bigger than this in the regions. The biggest difference between persons entitled to vote in the region and the candidates is found among the Swedish People's Party candidates in Central Ostrobothnia and the Coalition Party candidates in Central and North Ostrobothnia, as their median income is nearly double compared with persons entitled to vote in the region. The SDP candidates in Kainuu earn 77 per cent more than persons entitled to vote in the area. The Centre Party candidates in Etelä-Savo have 65 per cent higher median income than persons entitled to vote in the region.
The Green League, Left Alliance and Christian Democrat candidates differ usually less than average from persons entitled to vote, the biggest difference for the Greens is in Etelä-Savo (45 per cent higher income), for the Left Alliance in Ostrobothnia (42%) and for the Christian Democrats in South Karelia (47%). The True Finns are very close to the income level of persons entitled to vote: in Päijät-Häme and North Ostrobothnia even slightly below that of persons entitled to vote. The income of the Communist Party candidates remains below that of persons entitled to vote, except for the region of Päijät-Häme. (Table 16.)
Table 16. Candidates’ median income by party compared to median income of persons entitled to vote by region in Municipal elections 2012, persons entitled to vote = 100
| Persons entitled to vote |
Candidates | KOK | SDP | PS | CENT | GREENS | LEFT | RKP | KD | SKP | Oth. | |
| Mainland Finland |
100 | 139 | 172 | 145 | 108 | 142 | 128 | 122 | 165 | 121 | 88 | 105 |
| Uusimaa | 100 | 135 | 171 | 138 | 114 | 141 | 132 | 118 | 141 | 109 | 90 | 100 |
| Greater Helsinki region |
100 | 131 | 180 | 148 | 118 | 151 | 134 | 126 | 143 | 101 | 94 | 62 |
| Varsinais-Suomi | 100 | 139 | 175 | 149 | 118 | 127 | 133 | 119 | 174 | 105 | 77 | 75 |
| Satakunta | 100 | 149 | 179 | 164 | 110 | 147 | 120 | 130 | .. | 131 | .. | 107 |
| Kanta-Häme | 100 | 141 | 171 | 141 | 116 | 141 | 124 | 127 | .. | 137 | .. | .. |
| Pirkanmaa | 100 | 143 | 179 | 148 | 119 | 138 | 129 | 134 | .. | 144 | 96 | 105 |
| Päijät-Häme | 100 | 146 | 177 | 154 | 99 | 133 | 123 | 112 | .. | 136 | 108 | 138 |
| Kymenlaakso | 100 | 144 | 183 | 158 | 103 | 149 | 119 | 117 | .. | 123 | .. | 142 |
| South Karelia |
100 | 149 | 182 | 148 | 100 | 157 | 110 | 91 | .. | 147 | .. | 102 |
| Etelä Savo |
100 | 154 | 178 | 165 | 104 | 165 | 145 | 127 | .. | 120 | .. | 133 |
| Pohjois Savo |
100 | 144 | 178 | 161 | 119 | 157 | 117 | 135 | .. | 120 | 38 | 109 |
| North Karelia |
100 | 142 | 176 | 155 | 105 | 156 | 93 | 113 | .. | 115 | .. | 99 |
| Central Finland |
100 | 141 | 172 | 154 | 113 | 145 | 101 | 118 | .. | 128 | 79 | 53 |
| South Ostrobothnia |
100 | 151 | 179 | 144 | 105 | 166 | 127 | 123 | .. | 125 | .. | 115 |
| Ostrobothnia | 100 | 149 | 167 | 141 | 113 | 148 | 95 | 142 | 168 | 134 | .. | 144 |
| Central Ostrobothnia |
100 | 146 | 189 | 135 | 120 | 159 | 75 | 104 | 195 | 130 | .. | 127 |
| North Ostrobothnia |
100 | 145 | 189 | 149 | 99 | 157 | 129 | 133 | .. | 132 | .. | 94 |
| Kainuu | 100 | 145 | 176 | 177 | 113 | 155 | 79 | 128 | .. | 94 | .. | 101 |
| Lapland | 100 | 139 | 172 | 147 | 112 | 150 | 103 | 126 | .. | 145 | 68 | 120 |
Among the elected councillors, the median income subject to state taxation in 2010 is, on average, 72 per cent higher than among persons entitled to vote. For those elected from the Coalition Party the median income is more than double and for those from the Swedish People's Party nearly double compared with persons entitled to vote. The True Finns are closest to persons entitled to vote in their income level, as their median income is around one-third higher than among persons entitled to vote.
By region, the difference between persons entitled to vote is largest in the Helsinki region, where the income of elected councillors is more than double that of persons entitled to vote. The True Finns elected in North Ostrobothnia are closest to the income level of persons entitled to vote, as their median income is 17 per cent higher. In turn, those elected from the Coalition Party in the Helsinki region are farthest from the income level of persons entitled to vote, since their median income is over 2.5 times as high as that of voters in the region.
Table 17. Elected councillors' median income by party compared to median income of persons entitled to vote by region in Municipal elections 2012, persons entitled to vote = 100
| Persons entitled to vote |
Councillors | KOK | SDP | PS | CENT | GREENS | LEFT | RKP | KD | SKP | Oth. | |
| Mainland Finland |
100 | 172 | 212 | 174 | 133 | 166 | 182 | 156 | 192 | 173 | .. | 174 |
| Uusimaa | 100 | 182 | 221 | 174 | 155 | 172 | 176 | 164 | 192 | 182 | .. | 170 |
| Greater Helsinki region |
100 | 222 | 263 | 239 | 166 | .. | 189 | 215 | 238 | .. | .. | .. |
| Varsinais-Suomi | 100 | 173 | 203 | 170 | 142 | 160 | 187 | 157 | 231 | 169 | .. | 132 |
| Satakunta | 100 | 186 | 214 | 195 | 147 | 180 | .. | 150 | .. | 155. | .. | .. |
| Kanta-Häme | 100 | 172 | 214 | 160 | 147 | 177 | 137 | 165 | .. | 207 | .. | .. |
| Pirkanmaa | 100 | 179 | 212 | 186 | 146 | 174 | 177 | 168 | .. | 209 | .. | .. |
| Päijät-Häme | 100 | 175 | 216 | 183 | 132 | 143 | 179 | 177 | .. | 222 | .. | .. |
| Kymenlaakso | 100 | 191 | 217 | 205 | 170 | 154 | 147 | 187 | .. | .. | .. | .. |
| South Karelia |
100 | 196 | 210 | 216 | 130 | 173 | .. | .. | .. | 240 | .. | 209 |
| Etelä Savo |
100 | 184 | 221 | 189 | 135 | 195 | .. | .. | .. | 192 | .. | 215 |
| Pohjois Savo |
100 | 186 | 231 | 186 | 132 | 186 | 222 | 190 | .. | 198 | .. | .. |
| North Karelia |
100 | 179 | 218 | 184 | 137 | 197 | .. | 184 | .. | 125 | .. | .. |
| Central Finland |
100 | 169 | 229 | 173 | 129 | 163 | 131 | 146 | .. | 184 | .. | .. |
| South Ostrobothnia |
100 | 184 | 206 | 172 | 141 | 190 | .. | 169 | .. | 170 | .. | .. |
| Ostrobothnia | 100 | 178 | 262 | 178 | 145 | 186 | .. | .. | 181 | 174 | .. | .. |
| Central Ostrobothnia |
100 | 183 | 232 | 174 | 133 | 181 | .. | .. | .. | .. | .. | .. |
| North Ostrobothnia |
100 | 168 | 228 | 176 | 117 | 174 | 208 | 154 | .. | .. | .. | 163 |
| Kainuu | 100 | 181 | 259 | 205 | 137 | 184 | .. | 163 | .. | .. | .. | .. |
| Lapland | 100 | 176 | 212 | 180 | 145 | 183 | 127 | 164 | .. | .. | .. | 171 |
1.9. Income brackets
In the following, comparisons are made on the division of candidates into income quintiles that are formed on the basis of the income subject to state tax of persons entitled to vote. In the division into income quintiles the income brackets are determined so that there is an equal number of persons in each quintile, i.e. 20 per cent of the persons entitled to vote. For the sake of comparison, employed persons in 2009 are also examined in the same income brackets.
In 2010 the lowest quintile among persons entitled to vote earned under EUR 9,166 and the highest quintile over EUR 37,161. Nearly seven per cent of employed persons and 11 per cent of the candidates belong to the lowest quintile. Correspondingly, one third of employed persons and nearly 35 per cent of the candidates belong to the highest income quintile. Almost one half of the Coalition Party and Swedish People's Party candidates belong to the highest income bracket. The proportion of low-income candidates is highest among the candidates of the Communist Party of Finland, the Green League and the Left Alliance. (Figure 25.)
Roughly one half of the elected councillors belonged to the highest quintile and only around five per cent to the lowest.
Figure 25. Persons entitled to vote, candidates (by party) and elected councillors by income bracket in Municipal elections 2012, %
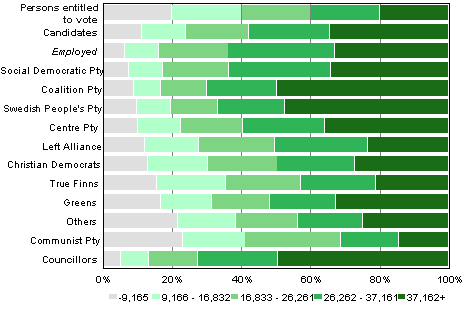
Table 18. Persons entitled to vote, candidates (by party) and elected councillors by income bracket in Municipal elections 2012, %
| –9,165 | 9,166–16,832 | 16,833–26,261 | 26,262–37,161 | 37,162+ | |
| Persons entitled to vote |
20.0 | 20.0 | 20.0 | 20.0 | 20.0 |
| Candidates | 11.2 | 12.7 | 18.1 | 234 | 34.6 |
| Employed | 6.4 | 9.7 | 20.1 | 30.7 | 33.1 |
| Finnish Social Democratic Pty SDP |
7.6 | 9.7 | 19.1 | 29.4 | 34.2 |
| National Coalition Pty KOK |
8.9 | 7.9 | 13.3 | 20.3 | 49.7 |
| Swedish People's Pty in Finland RKP |
9.7 | 9.8 | 13.6 | 19.5 | 47.4 |
| Centre Pty of Finland CENT |
10.1 | 12.3 | 18.1 | 23.5 | 36.0 |
| Left Alliance LEFT |
12.0 | 15.7 | 22.0 | 26.7 | 23.6 |
| Christian Democrats in Finland KD |
13.0 | 17.2 | 20.1 | 22.5 | 27.1 |
| True Finns PS |
15.5 | 20.1 | 21.6 | 21.5 | 21.3 |
| Green League GREENS |
16.8 | 14.6 | 16.7 | 19.1 | 32.7 |
| Others | 21.5 | 17.0 | 17.7 | 18.8 | 25.0 |
| Communist Pty of Finland SKP |
23.0 | 18.1 | 27.6 | 16.8 | 14.5 |
| Councillors | 5.2 | 8.1 | 14.2 | 23.0 | 49.5 |
Examined by income decile, around 19 per cent of the candidates belong to the highest income decile. The deciles were formed on the basis of the income of all persons entitled to vote, that is, ten per cent of those entitled to vote belong to each decile. As many as one third of the Coalition Party and Swedish People's Party candidates belong to the highest income decile. The Left Alliance, True Finns and Communist Party candidates are on level with or at a lower level than persons entitled to vote. (Figure 26.)
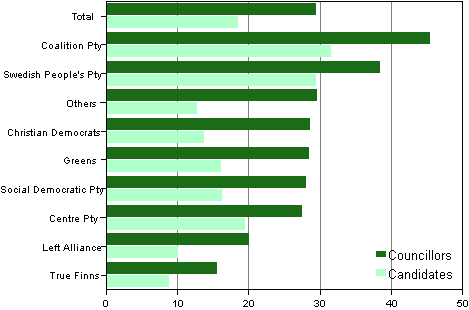
Thirty per cent of the elected councillors belong to the highest income decile, that is, their annual income subject to state taxation was over EUR 48,396 per year in 2010. Nearly 40 per cent of those elected from the Coalition Party and nearly 40 per cent of those from the Swedish People's Party belong to the highest income decile. Only 15 per cent of the elected True Finns belong to the highest income decile. (Figure 27.)
Figure 26. Proportion of persons belonging to the highest income decile by party in Municipal elections 2012 and 2008, %
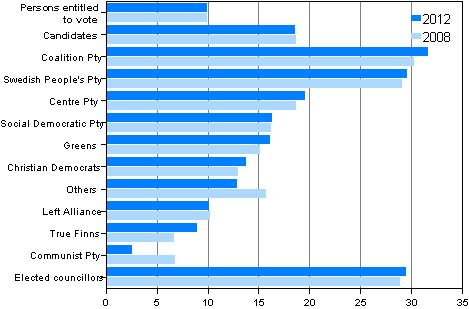
Figure 27. Proportion of persons belonging to the highest income decile among candidates and elected councillors by party in Municipal elections 2012 and 2008, %
Source: Municipal Elections 2012, confirmed result and background analysis of candidates and elected representatives, Statistics Finland
Inquiries: Kimmo Moisio 09 1734 3239, Jaana Asikainen 09 1734 3506, Kaija Ruotsalainen 09 1734 3599, Miina Keski-Petäjä 09 1734 3240, vaalit@stat.fi
Director in charge: Jari Tarkoma
Updated 2.11.2012
Official Statistics of Finland (OSF):
Municipal elections [e-publication].
ISSN=2323-1114. 2012,
1. Background analysis of candidates and elected councillors in Municipal elections 2012
. Helsinki: Statistics Finland [referred: 19.2.2026].
Access method: http://stat.fi/til/kvaa/2012/kvaa_2012_2012-11-02_kat_001_en.html

