

1. Background analysis of candidates and elected councillors in Municipal elections 2021
Background information of persons entitled to vote and of the candidates nominated by the parties and of elected councillors are examined in the following review. The data on persons entitled to vote derive from the voting register established on 23 April 2021 and the data on the candidates from the candidate register set up on 14 May 2021. The background data are based on Statistics Finland’s statistical data, such as population, employment and family statistics and the Register of Completed Education and Degrees.
The candidates differ by age and sex structure from all persons entitled to vote. Considerably fewer of the candidates are aged under 30 and over 70 than among persons entitled to vote and more of them are men than women. This should be considered when comparing the candidates with persons entitled to vote. In the tables and figures of the analysis the data are not age-standardised. Standardisation would slightly lower the difference between the candidates and those entitled to vote, for example, when comparing the level of education, main type of activity, family status and socio-economic group among the candidates and persons entitled to vote.
Only the parliamentary parties are specified in the following examination. The candidates nominated by other parties and constituency associations are presented as one category “Others”.
1.1. Summary
Most council seats for the Centre Party, the Finns Party increased their council seats mostThe tendency in the 2000s towards the number of candidates falling in Municipal elections now made an upturn. Now, 35,627 candidates were nominated for the Municipal elections, which is 2,009 more than in 2017. However, the number of candidates fell for many parties. The Centre Party and the Social Democratic Party lost their candidates most compared with the previous elections. The Centre Party has 590 fewer candidates and the Social Democratic Party 512 fewer than in the 2017 elections. The Finns Party increased their number of candidates most; their number of candidates went up by 2,122, or by 55 per cent, from the previous elections.
A total of 8,859 councillors were elected to municipal councils. Although in the number of votes cast the Coalition Party and the Social Democratic Party were clearly ahead of the Centre Party, the Centre Party still has the most council seats (2,445) despite losing a total of 379 seats compared with 2017. The Centre Party’s share of all council seats was 27.6 per cent. The Coalition Party has the second most council seats (17.5% of all elected councillors) and the Social Democratic Party the third most (16.4%). The Finns Party increased its share of council seats by 6.7 percentage points from 8.6 to 15.3 per cent.
The proportion of female candidates has remained at around 40 per cent already for a long time. Only the Green League has more female than male candidates. Around 60 per cent of its candidates are women. Among the parliamentary parties, the Finns Party has the least female candidates, 22 per cent. Women’s share of the elected councillors rose to over 40 per cent. The rise from the previous elections amounts to 1.2 percentage points.
Candidates are, on average, one year younger than persons entitled to vote. Female candidates are, on average, four years younger than women entitled to vote, whereas male candidates are slightly over one year older than men entitled to vote. Female candidates are nearly three years younger than male candidates. The average age of male candidates is 51.0 years and that of female candidates 48.3.
The average age of the elected councillors is 50.8 years, around six months higher than in the previous elections. Approximately one fifth are aged under 40 and 29 per cent were aged 60 or older. Considerably fewer persons aged under 40 were elected than in 2017, when one -quarter of elected councillors belonged to this age group.
Around forty-four per cent of council seats went to others than current councillorsOver one-half of all the candidates nominated by the parties were also candidates in the 2017 Municipal elections. Forty-seven per cent of the candidates were now in the same party as in the previous elections and around three per cent were candidates on the list of some other party or constituency association. Since the previous elections, the Finns Party has renewed its list of candidates most, as 60 per cent of their candidates were not candidates in the previous Municipal elections. Around 16 per cent of the candidates nominated by the new party, Movement Now, were candidates for some other party or constituency association in the 2017 elections.
Nearly one-fifth of the candidates are current councillors. The Centre Party has the most current councillors on its list, around 27 per cent of the party's candidates. Altogether, 176 of the candidates are Members of Parliament. 43.9 per cent of the members of the new councils were not municipal councillors at the time of the elections.
The Centre Party candidates dominate in small municipalities measured by population with fewer than 20,000 inhabitants. In municipalities with fewer than 5,000 inhabitants as many as 35 per cent of all candidates were nominated by the Centre Party. In the largest municipalities with over 100,000 inhabitants, the party distribution is clearly more even and no party has over 20 per cent of the candidates. In small municipalities with fewer than 20,000 inhabitants the Centre Party gained most council seats, in larger municipalities the Coalition Party is the majority party.
Persons with foreign background under-representedCompared with persons entitled to vote, persons with foreign background are under-represented among candidates. Persons of foreign background, that is, those whose both parents were born abroad, represent around seven per cent of those entitled to vote, 2.7 per cent of candidates and 0.8 per cent of elected councillors. The Swedish People's Party has the most candidates with foreign background (5.6%) and the Finns Party has the least (1.5%).
The result is similar when examined by native language. Clearly fewer candidates and elected councillors than persons entitled to vote speak a foreign language as their native language. The number of candidates speaking foreign languages is 953. The largest group of foreign-language speaking candidates is formed by Russian speakers, 191 candidates, and the second largest by Estonian speakers, 95 candidates. Of the elected councillors, 75 are foreign-language speakers. The largest foreign-language groups were speakers of English, 12 of the elected councillors and Somali, 10.
There are citizens from over 60 different countries among the candidates even though the share of foreign citizens among all candidates is under one per cent. In all, 4.5 per cent of all persons entitled to vote are foreign citizens. Of the candidates, 331 persons are foreign citizens. Under ten of the elected councillors are foreign citizens.
A person can have more than one nationality. There are 637 candidates that are Finnish citizens with citizenship in another country as well. They represent 1.8 per cent of all candidates. Among all persons entitled to vote, around 2.4 per cent have dual citizenship. Sixty-four dual citizens were elected as councillors.
Candidates and elected councillors are more highly educated and more actively in working lifeThe education of the candidates differs clearly from that of persons entitled to vote. Nearly 90 per cent of the candidates have completed post-comprehensive level qualifications while 76 per cent of those entitled to vote have done so. This is largely explained by the different age structure of people entitled to vote and the candidates. The educational level is highest for the Green League candidates. More than 60 per cent of them have tertiary level qualifications, while this is so for 36 per cent of all candidates and for 24 per cent of all persons entitled to vote.
Persons elected to municipals councils are more highly educated than those entitled to vote and the candidates. Of those elected, around 44 per cent have tertiary level qualifications and slightly under seven per cent only have basic level of education.
The difference in the age structure of the candidates, elected councillors and persons entitled to vote is also reflected in labour market position: nearly 80 of the elected councillors, 70 per cent of the candidates and slightly more than one half of those entitled to vote are employed persons. In turn, 31 per cent of those entitled to vote are retired, while this is the case for 18 per cent of candidates and 15 per cent of elected councillors. The employment rate is calculated as the share of employed persons in working-age population aged 18 to 64. The employment rate of the candidates is around 81 per cent, while that of persons entitled to vote is around ten percentage points lower, i.e. around 72 per cent. The employment rate of elected councillors is high, 90 per cent for the whole country. It is nine percentage points higher than that of candidates and nearly 20 per cent higher than that of persons entitled to vote.
Viewed by socio-economic group, there are more self-employed persons among the candidates and elected councillors than among persons entitled to vote. The share of self-employed persons among employed elected councillors is 23.5 per cent, 17.5 per cent among candidates and 10 per cent among persons entitled to vote. The highest proportions of self-employed persons are found among the candidates of the Movement Now party (27.8%) and the second highest among Centre Party candidates (26.9%), of whom over one half are farmers and forestry entrepreneurs. Among Coalition Party candidates around one quarter are also self-employed.
The public sector employs candidates more than persons entitled to vote. Around 36 per cent of employed elected councillors work in the public sector, close on one-third of candidates, and 27 per cent of employed persons entitled to vote. The public sector employs candidates most in the largest municipalities with over 50,000 inhabitants. In these municipalities, especially the share of those working in the central government sector is higher than in smaller municipalities. In small municipalities with fewer than 5,000 inhabitants, the share of self-employed persons among employed candidates is over one quarter.
Around forty per cent of elected councillors are parents of a family with childrenThe candidates and elected councillors also differ in their family status from the persons entitled to vote: 40 per cent of elected councillors and around 34 per cent of candidates are parents of a family with children, that is, considerably more than among persons entitled to vote (22%). Nearly 14 per cent of elected councillors and around 21 per cent of candidates live alone, while around 28 per cent of persons entitled to vote live alone. Differences in the family status are explained by the fact that the age structure of the candidates and persons entitled to vote differ from each other.
The current family status does not reveal how many of the candidates and of those entitled to vote have or have had children of their own. This can, however, be examined based on the number of children recorded in the Finnish Population Information System. Candidates and elected councillors have more children than average. In all, 78 per cent of the candidates and 85 per cent of elected councillors have children of their own, whereas the corresponding figure for persons entitled to vote is 65 per cent. The candidates have an average of two children, elected councillors 2.3 and persons entitled to vote have 1.5 children. The number of children is highest among Christian Democrats, 2.5 children and lowest among Green League candidates, 1.6 children.
Income level highest for Coalition Party candidates and elected councillorsCompared to persons entitled to vote, the candidates and elected councillors are more highly educated and a larger share of them are also working. This also partially explains that their income level is higher than that of persons entitled to vote. The median for disposable monetary income among candidates in 2019 was EUR 28,400, among elected councillors EUR 33,700 and among persons entitled to vote EUR 22,300. Disposable monetary income refers to the monetary income after taxes that consists of earned income, property income, and transfer income.
The median for the candidates’ disposable monetary income varies by party from EUR 33,900 in the Coalition Party to EUR 25,100 in the Left Alliance. When the population entitled to vote is arranged according to income and divided into ten equal parts, the income deciles of the population entitled to vote are generated. Each decile contains around 440,000 persons. The highest-income decile of the population entitled to vote has at least EUR 41,400 at their disposal and the lowest income decile at most EUR 9,400 per year.
Among all candidates, 18 per cent belong to the highest income decile and of the elected councillors nearly 30 per cent. The Coalition Party candidates and elected councillors are at the higher end of the income distribution. Thirty-six per cent of male candidates and 25 per cent of female candidates in the National Coalition Party belong to the highest income decile. Nearly one-half of the Coalition Party's elected councillors belong to the highest income decile.
There are fewer women in the highest income decile among persons entitled to vote, candidates and elected councillors. Around one-third of the elected men belong to the highest income decile and close on one-quarter of the elected women.
One-tenth of all persons entitled to vote thus belong to the lowest income decile. Fewer of the candidates, slightly under six per cent, belong to this decile. Examined by party, the highest proportion of candidates belong to the lowest income decile in Movement Now and the Green League, slightly over eight per cent. Only around three per cent of the elected councillors belong to the lowest income decile.
1.2. Candidates, elected councillors and persons entitled to vote by sex
Finns Party council seats increased by 75 per cent, the fourth largest party by the number of seats
A total of 35,627 candidates were nominated for the Municipal elections. This is 2,009 candidates more than in 2017.
As in previous years, the Centre Party of Finland (6,871) had the most candidates, even though its number of candidates is considerably lower than in the previous election. The Coalition Party (6,010 candidates) nominated the second most candidates and the Finns Party the third most (5,953 candidates). (Table 1)
The number of candidates grew most both in absolute and relative terms for the Finns Party, the lists of which now have 2,122 candidates, or 55 per cent more than in the 2017 elections. The number of candidates also grew in the Coalition Party (+271), the Green League (+203) and the Swedish People's Party (+61). The numbers of candidates nominated by the other parties fell from the previous Municipal elections. The number of Centre Party candidates fell most (-590). The number of SDP candidates fell by 512 persons and that of Christian Democrats by 26 persons.
A total of 8,859 councillors were elected to the municipal councils of Mainland Finland. This is 140 fewer councillors than in 2017. The decrease in the number of elected councillors is affected by municipal mergers between the elections and changes in the population on the level of municipalities. In 2017, councillors were elected for 295 municipal councils, now there are two fewer municipalities.
All in all, the number of elected councillors decreased by 1.6 per cent from the previous elections. In relative terms, most seats were lost by the Left Alliance (-22.8%) and the Green League (-18.9%). The number of elected councillors also decreased more than average for the Social Democratic Party and the Centre Party. The number of councillors grew most for the Finns Party both in absolute numbers and in relative terms. Compared with 2017, the number of seats for the Finns Party elected to councils increased by 581 persons, or by around 76 per cent. Compared to 2012, the Finns Party also increased their number of seats. The Coalition Party and representatives of the constituency associations and smaller parties also increased their number of seats.
Although in the number of votes cast the Coalition Party and the Social Democratic Party were clearly ahead of the Centre Party, the Centre Party still has the most council seats (2,445) despite losing a total of 379 seats compared with 2017. The Centre Party’s share of all council seats was 27.6 per cent.
The Coalition Party has the second most council seats (17.5% of all elected councillors) and the Social Democratic Party the third most (16.4%). The Finns Party increased its share of council seats by 6.7 percentage points from 8.6 to 15.3 per cent.
Table 1. Number of candidates and elected councillors by party in Municipal elections 2012, 2017 and 2021
| Number of candidates |
Change from the previous elections, % |
Number of elected councillors |
Change from the previous elections, % |
|||||||||
| 2012 | 2017 | 2021 | 2012 | 2017 | 2021 | 2012 | 2017 | 2021 | 2012 | 2017 | 2021 | |
| Candidates | 37,124 | 33,618 | 35,627 | -3.6 | -9.4 | 6.0 | 9,674 | 8,999 | 8,859 | -7.1 | -7.0 | -1.6 |
| Finnish Social Democratic Party SDP |
6,987 | 6,132 | 5,620 | -9.3 | -12.2 | -8.3 | 1,729 | 1,697 | 1,451 | -16.3 | -1.9 | -14.5 |
| The Finns Party PS |
4,393 | 3,831 | 5,953 | 138.8 | -12.8 | 55.4 | 1,195 | 770 | 1,351 | 169.8 | -35.6 | 75.5 |
| National Coalition Party KOK |
6,874 | 5,739 | 6,010 | -9.9 | -16.5 | 4.7 | 1,735 | 1,490 | 1,552 | -14.1 | -14.1 | 4.2 |
| Centre Party of Finland KESK |
8,401 | 7,461 | 6,871 | -15.8 | -11.2 | -7.9 | 3,077 | 2,824 | 2,445 | -12.5 | -8.2 | -13.4 |
| Green League VIHR |
2,299 | 2,600 | 2,803 | 4.9 | 13.1 | 7.8 | 323 | 534 | 433 | -12.7 | 65.3 | -18.9 |
| Left Alliance VAS |
3,506 | 3,203 | 3,010 | -14.7 | -8.6 | -6.0 | 640 | 658 | 508 | -23.2 | 2.8 | -22.8 |
| Swedish Peoples Party in Finland RKP |
1,350 | 1,324 | 1,385 | -4.1 | -1.9 | 4.6 | 480 | 471 | 463 | -6.1 | -1.9 | -1.7 |
| Christian Democrats in Finland KD |
1,870 | 1,971 | 1,945 | -2.7 | 5.4 | -1.3 | 300 | 316 | 311 | -14.5 | 5.3 | -1.6 |
| Movement Now LIIKE |
- | - | 469 | - | - | - | - | - | 49 | - | - | - |
| Others | 1,444 | 1,357 | 1,561 | -16.4 | -6.0 | 15.0 | 195 | 239 | 296 | -35.0 | 22.6 | 23.8 |
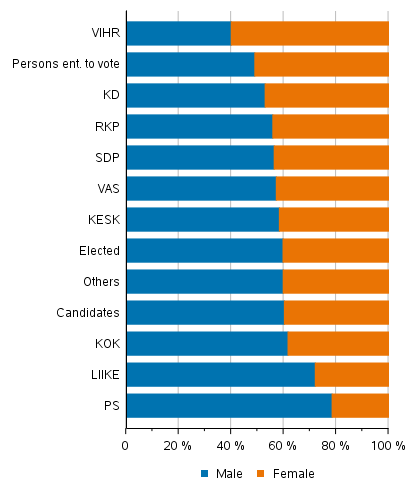
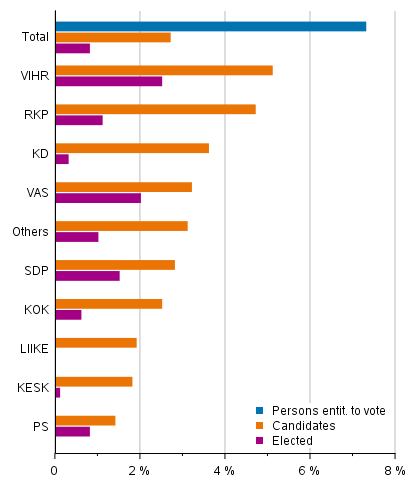
Women make up 39.7 per cent of the candidates. The majority, or 51 per cent, of the persons entitled to vote are women. Not much change took place from the 2017 elections. Only the Green League has more female than male candidates. Sixty per cent of its candidates are women. The Christian Democrats have the second most female candidates, as the proportion of women is 47 per cent and the Swedish People's Party has the third most, 44.1 per cent. The proportion of female candidates is above the average in the Centre Party, the Left Alliance and the Social Democratic Party, varying between 41.6 and 43.6 per cent. The Finns Party has the least female candidates, 21.5 per cent of candidates. There are also relatively few women (27.9%) among the candidates of the new party, Movement Now. The proportion of female candidates has also decreased from the previous elections in the Finns Party and the Coalition Party. (Figure 1)
Women make up 40.2 per cent of the elected councillors. The share of women among elected councillors rose by 1.2 percentage points from the previous elections. The proportion of women is slightly higher among new councillors, or among those who are not municipal councillors at the moment (42.8%).
A distinct majority of the elected Green League councillors are women, around 74 per cent. The Social Democratic Party (48.7%), the Left Alliance (47.8%) and the Christian Democrats (46.6%) also have more elected women than average. The least women were elected to municipal councils from the Finns Party. Just slightly over one-fifth of them are women. The proportion of women elected to councils from Movement Now, the Coalition Party and the Centre Party is also under 40 per cent. (Figure 1)
Figure 1. Persons entitled to vote, candidates (by party) and elected councillors by sex in Municipal elections 2021, %
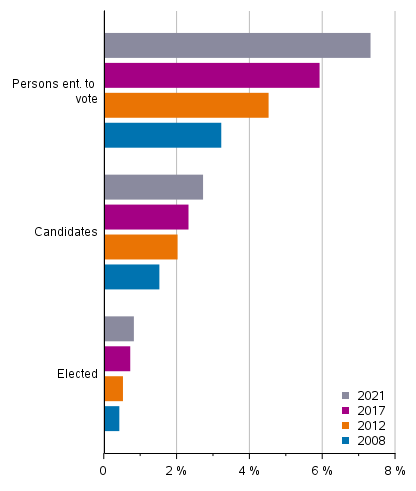
Women’s share of all candidates has remained at around 40 per cent throughout the 2000s. Among most parties, the share of female candidates has remained more or less on the same level. Only the Left Alliance, Green League and SDP have clearly increased their share of female candidates in recent years. The proportion of female candidates has increased by over six percentage points since 2008 in the Left Alliance, by over three percentage points in the Green League and by 2.8 percentage points in the Social Democratic Party. For the Finns Party, the share of women is now lowest in the 2000s. It is over four percentage points lower than in the 2008 elections and compared with the previous 2017 elections, women's proportion is 3.7 percentage points lower.
Table 2. Women's proportion of persons entitled to vote, candidates and elected councillors by party in Municipal elections 2008 to 2021, %
| 2008 | 2012 | 2017 | 2021 | ||
| Persons ent. to vote | 51.5 | 51.4 | 51.2 | 51.0 | |
| Candidates | Candidates | 40.4 | 38.8 | 39.9 | 39.7 |
| Finnish Social Democratic Party SDP | 40.8 | 40.4 | 40.9 | 43.6 | |
| The Finns Party PS | 25.7 | 23.3 | 25.2 | 21.5 | |
| National Coalition Party KOK | 40.3 | 39.1 | 39.0 | 38.3 | |
| Centre Party of Finland KESK | 40.3 | 39.8 | 39.7 | 41.6 | |
| Green League VIHR | 56.8 | 56.8 | 57.9 | 60.0 | |
| Left Alliance VAS | 36.6 | 37.9 | 39.8 | 42.8 | |
| Swedish Peoples Party in Finland RKP | 42.9 | 43.5 | 43.7 | 44.1 | |
| Christian Democrats in Finland KD | 48.2 | 45.3 | 46.7 | 47.0 | |
| Movement Now LIIKE | - | - | - | 27.9 | |
| Others | 33.6 | 32.8 | 33.8 | 40.2 | |
| Elected | Elected | 36.7 | 36.2 | 39.0 | 40.2 |
| Finnish Social Democratic Party SDP | 41.0 | 41.7 | 44.4 | 48.7 | |
| The Finns Party PS | 20.8 | 23.2 | 21.8 | 21.1 | |
| National Coalition Party KOK | 35.9 | 35.7 | 35.9 | 36.8 | |
| Centre Party of Finland KESK | 34.1 | 35.1 | 36.1 | 39.5 | |
| Green League VIHR | 64.3 | 68.1 | 67.8 | 74.1 | |
| Left Alliance VAS | 32.4 | 35.8 | 40.4 | 47.8 | |
| Swedish Peoples Party in Finland RKP | 38.2 | 38.3 | 40.1 | 43.0 | |
| Christian Democrats in Finland KD | 43.0 | 38.7 | 46.5 | 46.6 | |
| Movement Now LIIKE | - | - | - | 36.7 | |
| Others | 34.3 | 29.7 | 31.0 | 37.5 | |
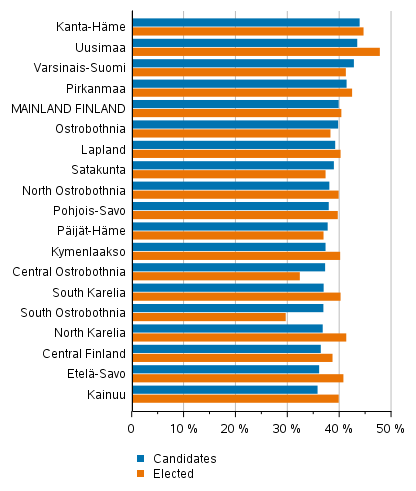
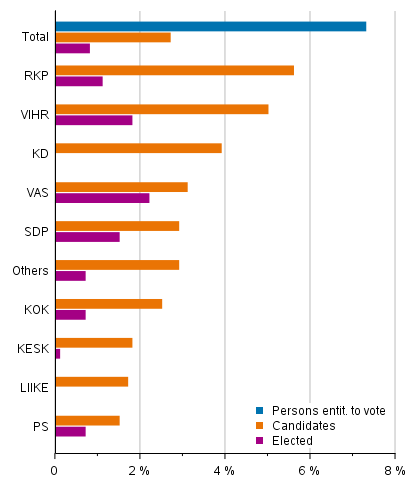
The percentages of female candidates were the highest in Kanta-H�me (43.7%) and Uusimaa (43.3%), and the lowest in Kainuu (35.6%) and South Savo (35.9%). In addition to Kanta-H�me and Uusimaa, only the regions of Southwest Finland and Pirkanmaa have more female candidates than average. (Figure 2)
Most women were elected into municipal councils in Uusimaa. Of the future councillors in municipal councils in Uusimaa, 47.6 per cent are women. The share of women among elected councillors was also above the average for the whole country in Kanta-H�me, Pirkanmaa, North Karelia, Varsinais-Suomi and South Savo.
The share of women among elected councillors is smallest in the region of South Ostrobothnia (29.5%). In these regions, also clearly fewer women were elected than were standing as candidates (36.7%). By contrast, the share of women among elected councillors in South Savo, North Karelia, Uusimaa and Kainuu is over four percentage points higher than their share of candidates.
Figure 2. Women’s share of candidates and elected councillors by region in Municipal elections 2021, %
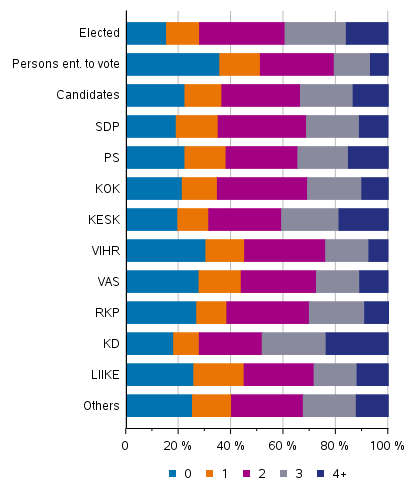
Altogether 44 per cent of elected councillors are new
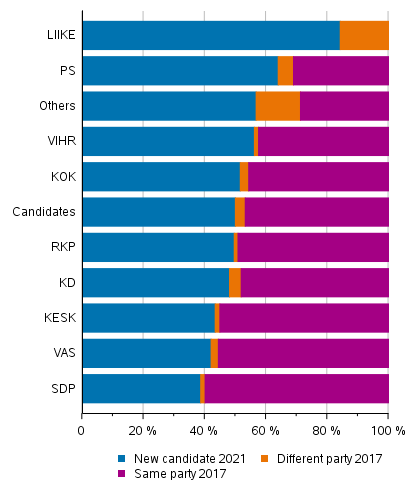
One-half of the candidates nominated by the parties are new, that is, they were not candidates in the 2017 elections. In total, 46.8 per cent of the candidates were candidates for the same party as in the previous elections and 3.2 per cent were candidates on the list of some other party or constituency association.
Of the parties that had candidates in 2017 and 2021, the Finns Party has the most new candidates, as many as 64 per cent of them are completely new. Over one-half of the Green League and Coalition Party candidates are also new, as are the group others, which includes constituency associations and parties that have no MPs in Parliament. Of the candidates nominated by the new Movement Now party, the majority, or 84 per cent, are new and the rest of the candidates were last time nominated by some other party. In both elections, slightly over three per cent of the candidates have changed parties, the most among the Finns Party candidates (5.0%). (Figure 3)
Close on one-fifth of all candidates are current councillors. The Centre Party has the most current councillors on its list, around 27 per cent of the party’s candidates and Movement Now has the least, 3.4 per cent and the Finns Party around ten per cent. Altogether, 176 of the candidates are Members of Parliament.
Figure 3. Share of candidates nominated in the 2017 election and new candidates by party in the Municipal elections 2021, %
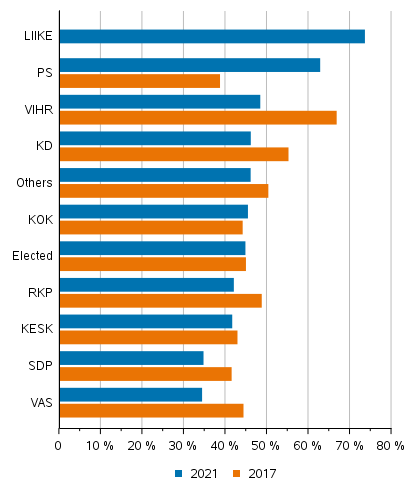
Altogether 8,859 councillors were elected to municipal councils of whom 3,888 or around 44 per cent were not municipal councillors at the time of the elections. Around 62 per cent of the elected councillors from the Finns Party are other than current municipal councillors and nearly two-thirds of the elected councillors from the new party, Movement Now, are new municipal councillors. The Left Alliance and the Social Democratic Party have the least new councillors, around one third were not municipal councillors during the elections. (Figure 4)
Figure 4. Proportion of new councillors by party in the Municipal elections 2017 and 2021, %
1.3. Age structure
Oldest councillors among Christian Democrats, youngest among the Green League
The average age of the candidates is now almost half a year higher than in the previous elections and around two years older than in 2008. Female candidates are nearly three years younger than male candidates. The average age of male candidates is now 51.0 years and that of female candidates 48.3. Female candidates are, on average, four years younger than women entitled to vote, whereas male candidates are slightly over one year older than men entitled to vote. The average age of persons entitled to vote has risen by nearly one year since the previous elections and by slightly over two years from 2008. On the day of the election the average age of persons entitled to vote is now 49.7 for men and 52.2 for women.
The sex and age structure of candidates is very different from that of persons entitled to vote (Figures 5 and 6). The age pyramid of neither group is no longer a pyramid as the name indicates: the age structure of persons entitled to vote rather resembles a tower and that of candidates a one sided gyroscope, from which the missing of the youngest and oldest age groups as well as the dominance of men are visible. Most male candidates represent the 45 to 69 age groups and most female candidates the 35 to 59 age groups.
Figure 5. Age distributions and average age of persons entitled to vote by sex in Municipal elections 2021, %
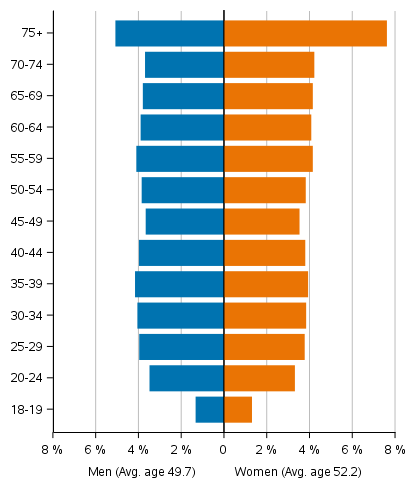
Figure 6. Age distributions and average age of candidates by sex in Municipal elections 2021, %
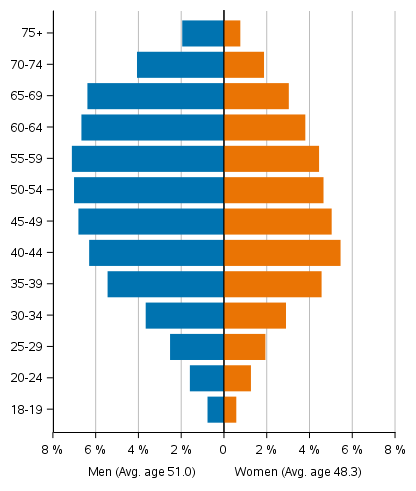
Examined by party, the Christian Democrats has the oldest candidates: Around 40 per cent of their candidates are aged 60 or over and the average age is 53.9 years. One-third of the Social Democratic Party and Left Alliance candidates are also aged 60 or over. The Green League has the youngest candidates. Almost 37 per cent of them are aged under 40, and the average age of the candidates is 44.6 years. Around 25 per cent of all candidates are aged under 40 and around 28 per cent are aged 60 or over. (Figure 6, Table 3)
Figure 7. Age distribution and average age of elected councillors by sex in the Municipal elections 2021, %

Around one-fifth of the elected councillors are aged under 40 and 29 per cent are aged 60 or over. Considerably fewer persons aged under 40 were elected than in 2017, when one -quarter of elected councillors belonged to this age group. The share of persons aged 60 or over among elected councillors also decreased by two percentage points.
The average age of the elected councillors was 50.8 years, which is around six months higher than in the previous elections. The Christian Democrats have the oldest elected councillors, on average, aged 55. The elected councillors from the Green League are, in turn, the youngest - their average age is 43. (Table 3)
Figure 8. Persons entitled to vote, candidates (by party) and elected councillors by age group in Municipal elections 2021, %
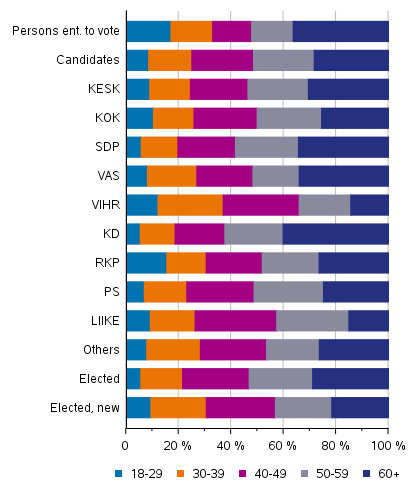
Table 3. Average age of candidates and elected councillors by party in the Municipal elections 2021
| Total | Male | Female | ||
| Persons ent. to vote | 51.0 | 49.7 | 52.2 | |
| Candidates | Candidates | 50.0 | 51.0 | 48.3 |
| Centre Party of Finland KESK | 50.4 | 51.8 | 48.4 | |
| National Coalition Party KOK | 49.1 | 49.8 | 48.1 | |
| Finnish Social Democratic Party SDP | 52.2 | 53.5 | 50.6 | |
| Left Alliance VAS | 50.7 | 52.9 | 47.8 | |
| Green League VIHR | 44.6 | 45.8 | 43.8 | |
| Christian Democrats in Finland KD | 53.9 | 54.2 | 53.5 | |
| Swedish Peoples Party in Finland RKP | 48.1 | 49.1 | 47.0 | |
| The Finns Party PS | 49.9 | 50.2 | 48.4 | |
| Movement Now LIIKE | 47.1 | 47.6 | 45.7 | |
| Others | 49.2 | 50.5 | 47.3 | |
| Elected | Elected | 50.8 | 52.6 | 48.2 |
| Centre Party of Finland KESK | 51.3 | 52.9 | 48.9 | |
| National Coalition Party KOK | 50.2 | 51.6 | 47.9 | |
| Finnish Social Democratic Party SDP | 53.4 | 56.2 | 50.4 | |
| Left Alliance VAS | 52.3 | 56.9 | 47.4 | |
| Green League VIHR | 42.9 | 45.8 | 41.9 | |
| Christian Democrats in Finland KD | 54.9 | 56.2 | 53.4 | |
| Swedish Peoples Party in Finland RKP | 50.0 | 51.7 | 47.8 | |
| The Finns Party PS | 49.0 | 49.8 | 46.0 | |
| Movement Now LIIKE | 49.2 | 49.7 | 48.4 | |
| Others | 51.0 | 52.6 | 48.4 | |
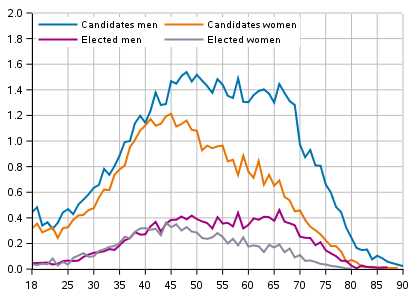
Altogether one per cent of men entitled to vote and 0.6 per cent of women are nominated as candidates. In all age groups, fewer women are nominated than men. The share of candidates of the age group raises sharply for women to about the age of 40 and for men to the age of about 50. At about the age of 40 women’s participation rate is only slightly lower than men’s but the difference grows after that. While women’s participation rate makes a downturn after the age of 45, men’s participation rate starts to fall only at the age of around 70 and drops to the same level as for 40-year-old men.
The proportion of male candidates per age group is at its highest in ages 42 to 69, when around 1.3 to 1.5 per cent of each 1-year age group are candidates. Among women, most stand as candidates between the ages 37 to 55, 1.0 to 1.1 per cent of the age group. (Figure 9)
The share of elected councillors in the age groups resemble the share of candidates in the age groups. It is likely that the share of elected councillors is larger, the larger the proportion of the age group that stood as candidates. Relative to the size of the age group, most men became elected among those aged slightly over 60. Among women, most became elected to councils at the age of slightly over 40. The shares of elected councillors among the age group were very similar for both men and women until the age of 44, after which the share of women starts to fall, while the share of men stays at the same level until the age of over 60.
Figure 9. Share of candidates and elected councillors in the age group by sex in Municipal elections 2021, %
Centre Party the biggest party in small municipalities, Coalition Party in bigger municipalities
The Centre Party has the highest number of candidates in small municipalities measured by population with fewer than 20,000 inhabitants. In municipalities with fewer than 5,000 inhabitants around 35 per cent of candidates were nominated by the Centre Party. In municipalities of this size category, the Finns Party and the National Coalition Party have nominated the second and third most candidates. In large municipalities with over 100,000 inhabitants the proportion of the Centre Party is about ten per cent of all candidates. (Table 4)
In larger municipalities no party reaches as large a share of the candidates as the Centre Party does in small municipalities. In municipalities with 20,000 to 99,999 inhabitants the three parties that nominated the most candidates were the Coalition Party, the Social Democratic Party and the Finns Party, each with close on 20 per cent of all candidates.
In the largest municipalities with over 100,000 inhabitants the party distribution of candidates is considerably more even: the Coalition Party and the Social Democratic Party have nominated the most candidates, that is, both parties have a proportion of slightly over 14 per cent. Large towns also have more candidates than average from the Green League and the Left Alliance. The share of the Finns Party among the candidates is about 17 per cent in municipalities with fewer than 100,000 inhabitants and around 14 per cent in larger towns.
In municipalities with under 20,000 inhabitants the Centre Party gained most seats in municipal councils. In municipalities with fewer than 5,000 inhabitants as many as over 40 per cent of elected councillors were from the Centre Party and in municipalities with 5,000 to 19,999 inhabitants 25 to 30 per cent. The Coalition Party, the Finns Party and the Social Democratic Party competed for the second and third places, with shares of 12 to 18 per cent of the seats. In municipalities with over 20,000 inhabitants most candidates were elected from the Coalition Party and the second most from the Social Democratic Party. The Finns Party won the third most council seats, except in the largest towns with over 100,000 inhabitants, where the Green League won the third place.
Table 4. Party distribution of candidates and elected councillors by size of municipality in the Municipal elections 2021, %
| Size category of municipality (population at the end of 2020, %) | ||||||||
| Total | -4,999 | 5,000-9,999 | 10,000-19,999 | 20,000-49,999 | 50,000-99,999 | 100,000+ | ||
| Candidates | Centre Party of Finland KESK |
19.3 | 35.3 | 24.5 | 20.1 | 13.1 | 13.2 | 9.8 |
| National Coalition Party KOK |
16.9 | 15.2 | 15.2 | 18.3 | 19.1 | 19.3 | 14.4 | |
| Finnish Social Democratic Party SDP |
15.8 | 12.0 | 15.0 | 16.9 | 18.2 | 18.5 | 14.3 | |
| Left Alliance VAS |
8.4 | 5.3 | 8.4 | 6.6 | 9.6 | 8.8 | 11.4 | |
| Green League VIHR |
7.9 | 2.5 | 4.5 | 5.7 | 9.8 | 11.5 | 13.4 | |
| Christian Democrats in Finland KD |
5.5 | 3.9 | 5.2 | 6.1 | 5.3 | 5.2 | 6.9 | |
| Swedish Peoples Party in Finland RKP |
3.9 | 1.1 | 5.3 | 5.1 | 3.0 | 3.3 | 5.6 | |
| The Finns Party PS |
16.7 | 17.5 | 16.6 | 17.6 | 17.7 | 17.1 | 13.9 | |
| Movement Now LIIKE |
1.3 | 0.4 | 0.8 | 0.7 | 1.3 | 1.3 | 3.2 | |
| Others | 4.4 | 6.8 | 4.6 | 2.8 | 2.8 | 1.7 | 7.0 | |
| Total | 100.1 | 100.0 | 100.1 | 99.9 | 99.9 | 99.9 | 99.9 | |
| Elected | Centre Party of Finland KESK |
27.6 | 43.6 | 29.8 | 25.2 | 14.8 | 14.7 | 8.8 |
| National Coalition Party KOK |
17.5 | 13.6 | 14.3 | 18.2 | 22.3 | 22.2 | 25.3 | |
| Finnish Social Democratic Party SDP |
16.4 | 12.2 | 15.0 | 17.4 | 20.5 | 21.8 | 19.0 | |
| Left Alliance VAS |
5.7 | 4.3 | 6.1 | 4.5 | 7.4 | 5.6 | 9.4 | |
| Green League VIHR |
4.9 | 1.4 | 2.5 | 4.4 | 8.2 | 8.9 | 15.6 | |
| Christian Democrats in Finland KD |
3.5 | 2.8 | 3.8 | 4.3 | 3.6 | 3.4 | 3.1 | |
| Swedish Peoples Party in Finland RKP |
5.2 | 1.5 | 9.2 | 8.1 | 3.9 | 5.0 | 2.6 | |
| The Finns Party PS |
15.3 | 14.3 | 14.6 | 15.8 | 16.8 | 17.7 | 13.8 | |
| Movement Now LIIKE |
0.6 | 0.3 | 0.5 | 0.5 | 0.6 | 0.6 | 1.6 | |
| Others | 3.3 | 6.1 | 4.3 | 1.7 | 1.7 | - | 0.8 | |
| Total | 100.0 | 100.1 | 100.1 | 100.1 | 99.8 | 99.9 | 100.0 | |
1.4. Foreign background
Less than one per cent of elected councillors are foreign-language speakers
The proportion of Swedish-speaking candidates (5.4 %) slightly exceeds their proportion of persons entitled to vote (4.6 %). Swedish-speaking candidates are more active particularly in Uusimaa and Ostrobothnia, 12.4 per cent of candidates in Uusimaa and 54.4 per cent in Ostrobothnia. Correspondingly, Swedish speakers account for 7.5 per cent of persons entitled to vote in Uusimaa and for 50.3 per cent in Ostrobothnia. (Table 5)
Slightly over seven per cent of all persons entitled to vote speak another language than Finland's national languages. Considerably fewer of the candidates, just 2.7 per cent are foreign-language speakers. The share of foreign-language speakers among candidates has, however, grown slightly from the 2017 elections when the share of foreign-language speaking candidates of all candidates was 2.2 per cent.
In relative terms, the number of foreign-language speaking candidates is highest in Ostrobothnia, where 5.3 per cent of candidates are foreign-language speakers and the second highest in Uusimaa, 4.8 per cent. The respective proportions among persons entitled to vote were 6.5 and 13.7 per cent.
On the level of mainland Finland, the under-representation of foreign-language speakers is 4.6 percentage points. This means that there are fewer foreign-language speaking candidates than foreign-language speaking persons entitled to vote. The under-representation is highest in areas where the population share of foreign-language speakers is largest, i.e. in Uusimaa – especially in the Greater Helsinki region – and in Southwest Finland. In Uusimaa, the share of foreign-language speakers is 8.9 and in Southwest Finland 4.6 percentage points lower than among persons entitled to vote.
Of national language speakers, there are more Sami speakers as candidates than average. Of Sami speakers entitled to vote, 2.3 per cent stand as candidates. Of all persons entitled to vote, on average, 0.8 per cent are candidates.
Of those elected to municipal councils under one per cent are foreign-language speakers, which is fewer than stood as candidates and considerably fewer than among persons entitled to vote. Most foreign-language speakers were elected to councils in Uusimaa and especially in the Greater Helsinki area. In Uusimaa municipalities 2.3 per cent of the new council members are foreign-language speakers. In Greater Helsinki, the share of foreign-language speakers is slightly over five per cent of elected councillors. No foreign-language speakers were elected to councils in the municipalities of South Savo.
More Swedish speakers were elected to municipal councils (6.3%) than their share among candidates or persons entitled to vote. Most Swedish speakers were elected in Ostrobothnia, where 71 per cent of elected councillors are Swedish-speaking. Around one-half of persons entitled to vote in Ostrobothnia are Swedish-speaking. Also in Uusimaa, more than double the number of Swedish speakers were elected as councillors (16.2%) compared to their share of persons entitled to vote. By contrast, in Central Ostrobothnia, the share of Swedish-speaking councillors (2.8%) was considerably lower than their share of the population (9.1%).
Table 5. Persons entitled to vote, candidates and elected councillors by native language by region in the Municipal elections 2021, %
| Persons ent. to vote | Candidates | Elected | |||||||
| Finnish, Sami | Swedish | Other language, unknown | Finnish, Sami | Swedish | Other language, unknown | Finnish, Sami | Swedish | Other language, unknown | |
| MAINLAND FINLAND | 88.1 | 4.6 | 7.3 | 91.9 | 5.4 | 2.7 | 92.8 | 6.3 | 0.8 |
| Uusimaa | 78.7 | 7.5 | 13.7 | 82.8 | 12.4 | 4.8 | 81.6 | 16.2 | 2.3 |
| Varsinais-Suomi | 87.3 | 5.6 | 7.2 | 91.0 | 6.4 | 2.6 | 92.3 | 6.3 | 1.4 |
| Satakunta | 96.0 | 0.3 | 3.7 | 98.1 | 0.4 | 1.5 | 99.6 | 0.2 | 0.2 |
| Kanta-H�me | 95.4 | 0.4 | 4.2 | 98.3 | 0.6 | 1.1 | 99.2 | 0.3 | 0.6 |
| Pirkanmaa | 94.7 | 0.4 | 4.9 | 97.5 | 0.6 | 1.9 | 99.1 | 0.4 | 0.5 |
| P�ij�t-H�me | 94.5 | 0.3 | 5.1 | 97.3 | 0.4 | 2.4 | 99.7 | - | 0.3 |
| Kymenlaakso | 93.3 | 0.8 | 5.9 | 95.1 | 1.6 | 3.3 | 97.3 | 1.8 | 0.9 |
| South Karelia | 93.8 | 0.2 | 6.0 | 96.1 | 0.1 | 3.8 | 99.6 | - | 0.4 |
| Etel�-Savo | 96.6 | 0.2 | 3.2 | 98.2 | - | 1.8 | 100.0 | - | - |
| Pohjois-Savo | 97.0 | 0.1 | 2.9 | 97.5 | 0.4 | 2.1 | 99.0 | 0.8 | 0.2 |
| North Karelia | 96.3 | 0.1 | 3.6 | 97.4 | 0.1 | 2.5 | 99.7 | - | 0.3 |
| Central Finland | 96.4 | 0.2 | 3.4 | 98.0 | 0.1 | 1.9 | 99.3 | - | 0.7 |
| South Ostrobothnia | 97.4 | 0.3 | 2.3 | 97.5 | 0.6 | 1.9 | 99.6 | - | 0.4 |
| Ostrobothnia | 43.2 | 50.3 | 6.5 | 40.3 | 54.4 | 5.3 | 27.2 | 71.0 | 1.8 |
| Central Ostrobothnia | 87.9 | 9.1 | 3.0 | 91.1 | 7.0 | 1.8 | 96.7 | 2.8 | 0.6 |
| North Ostrobothnia | 96.9 | 0.2 | 2.9 | 98.4 | 0.2 | 1.4 | 99.5 | - | 0.5 |
| Kainuu | 97.2 | 0.1 | 2.7 | 98.4 | 0.1 | 1.4 | 99.5 | - | 0.5 |
| Lapland | 97.0 | 0.3 | 2.8 | 98.2 | 0.2 | 1.5 | 99.0 | - | 1.0 |
Foreign-language speakers are considerably less often candidates. Of the candidates, 953 are foreign-language speakers, which is 0.3 per cent of foreign-language speaking persons entitled to vote. The largest foreign-language speaking group among candidates is Russian speakers, 191 candidates, and the second largest is Estonian speakers, 95 candidates. (Table 6.)
Altogether, 75 foreign-language speakers were elected to councils. The largest foreign-language groups were speakers of English, 12 of the elected councillors and Somali, 10.
The Green League has the most foreign-language speaking candidates, 5.1 per cent of candidates and the Swedish People’s Party has the second most, 4.7 per cent. The Finns Party has the lowest share of foreign-language speaking candidates, 1.4 per cent. Among the elected councillors, the Green League has the most foreign-language speakers (2.5%). No foreign-language speakers were elected from the lists of Movement Now and only 0.1 per cent of the elected Centre Party councillors are foreign-language speakers. Although the Christian Democrats had the third highest proportion of foreign-language speaking candidates (3.5%) after the Green League and the Swedish People’s Party, only 0.3 per cent of the elected councillors were foreign-language speakers. (Figure 10)
Table 6. Persons entitled to vote and candidates by native language, largest language groups specified, in the Municipal elections 2021, %
| Persons entitled to vote | Candidates | % of persons entitled to vote | |
| Total | 4,464,815 | 35,627 | 0.8 |
| NATIONAL LANGUAGES, TOTAL | 4,141,093 | 34,674 | 0.8 |
| Finnish | 3,932,759 | 32,711 | 0.8 |
| Swedish | 206,848 | 1,929 | 0.9 |
| Sami | 1,486 | 34 | 2.3 |
| FOREIGN LANGUAGES, TOTAL | 323,722 | 953 | 0.3 |
| Russian | 65,372 | 191 | 0.3 |
| Estonian | 39,785 | 95 | 0.2 |
| English | 16,692 | 71 | 0.4 |
| Arabic | 20,514 | 50 | 0.2 |
| Persian, Farsi | 10,204 | 50 | 0.5 |
| Turkish | 6,531 | 40 | 0.6 |
| Kurdish | 10,213 | 36 | 0.4 |
| Spanish; Castilian | 7,307 | 30 | 0.4 |
| Somali | 13,261 | 26 | 0.2 |
| German | 5,819 | 25 | 0.4 |
| French | 3,890 | 22 | 0.6 |
Figure 10. Foreign-language speakers’ proportion of persons entitled to vote, candidates and elected councillors (by party) in Municipal elections 2021, %
Councillors of foreign background still fairly rare
The foreign background of the population can also be examined from the point of the person’s origin. Of the persons entitled to vote, 92.7 per cent and of candidates 97.3 per cent are of Finnish background, that is, persons of whose parents at least one was born in Finland. Thus, slightly over seven per cent of persons entitled to vote and nearly three per cent of candidates are of foreign background. Of the elected councillors, 0.8 per cent are of foreign background. Since 2008, the share of elected councillors of foreign background has grown from by 0.4 per cent.
Second generation immigrants, or those who were themselves born in Finland, but whose parents were born abroad, are still fairly few among both persons entitled to vote (0.3 per cent) and candidates (0.1 per cent). First generation immigrants (the person and parents both born abroad) are clearly under-represented both among the candidates and elected councillors. Of all persons entitled to vote, seven per cent belong to this group, while this is so for only 2.6 per cent of the candidates and for 0.7 per cent of elected councillors.
Table 7. Persons entitled to vote, candidates and elected councillors by origin in the Municipal elections 2008 to 2021
| Persons ent. to vote | Candidates | Elected | ||||||||||
| 2008 | 2012 | 2017 | 2021 | 2008 | 2012 | 2017 | 2021 | 2008 | 2012 | 2017 | 2021 | |
| Total | 4,196,532 | 4,303,064 | 4,397,006 | 4,464,815 | 38,505 | 37,124 | 33,618 | 35,627 | 10,412 | 9,674 | 8,999 | 8,859 |
| Persons with Finnish background total | 4,061,377 | 4,111,446 | 4,135,878 | 4,138,679 | 37,925 | 36,399 | 32,859 | 34,666 | 10,373 | 9,624 | 8,933 | 8,788 |
| Persons with Finnish background, born in Finland | 4,028,034 | 4,075,699 | 4,097,547 | 4,097,007 | 37,647 | 36,066 | 32,502 | 34,253 | 10,319 | 9,564 | 8,860 | 8,706 |
| Persons with Finnish background, born abroad | 33,343 | 35,747 | 38,331 | 41,672 | 278 | 333 | 357 | 413 | 54 | 60 | 73 | 82 |
| Persons with foreign background total | 135,155 | 191,618 | 261,128 | 325,802 | 580 | 725 | 759 | 961 | 39 | 50 | 66 | 71 |
| Persons with foreign background, born in Finland | 3,272 | 5,141 | 9,540 | 14,772 | 30 | 30 | 24 | 40 | 6 | 5 | 4 | 9 |
| Persons with foreign background, born abroad | 131,883 | 186,477 | 251,588 | 311,030 | 550 | 695 | 735 | 921 | 33 | 45 | 62 | 62 |
| Unknown | - | - | - | 334 | - | - | - | - | - | - | - | - |
Figure 11. The proportion of persons of foreign origin among persons entitled to vote, candidates and elected councillors in Municipal elections 2008, 2012, 2017 ja 2021, %
Latest data concerning the population living in Finland is from at the end of 2020
Examined by party, the number of candidates with foreign background is highest in the Swedish People’s Party, 5.6 per cent of the candidates, and lowest in the Finns Party (1.5 per cent) and Movement Now (1.7 per cent). The Green League and the Christian Democrats also have more than average candidates with foreign background. (Figure 10)
The Left Alliance has the largest proportion of persons with foreign background among councillors (2.2%) and the Green League has the second most (1.8%). None of the elected Christian Democrats and Movement Now councillors has a foreign background. A fairly small share of the elected councillors from the Centre Party are also of foreign background, i.e. 0.1 per cent.
Figure 12. Proportion of persons entitled to vote, candidates and elected councillors (by party) of foreign origin in Municipal elections 2021, %
Number of candidates with dual citizenship 637
There are citizens from over 60 different countries among the candidates even though the share of foreign citizens among all candidates is under one per cent. In all, 4.5 per cent of all persons entitled to vote are foreign citizens. Of the candidates, 331 persons are foreign citizens. The biggest nationality group is Estonian with 65 candidates, the second largest are Swedish with 32 and Russian with 31 candidates.
There are 637 candidates that are Finnish citizens with citizenship in another country as well. They represent 1.8 per cent of all candidates. Of all persons entitled to vote, there are nearly 108,000 persons with dual citizenship or 2.4 per cent. Among the candidates the most common second citizenship is Russian, 123 persons and Swedish, 67 persons.
Less than ten of the elected councillors are foreign citizens. Altogether 64 persons, who in addition to Finnish citizenship also hold the citizenship of some other country, were elected to municipal councils.
1.5. Level of education
Three-quarters of the Green League's elected councillors have tertiary level qualifications
The education of the candidates differs clearly from that of persons entitled to vote. Nearly 90 per cent of the candidates have completed post-comprehensive level qualifications while 76 per cent of those entitled to vote have done so. This is partially explained by the fact that there are very few representatives of the oldest age groups among the candidates whose educational level is usually lower than for younger persons. Thirty-three per cent of the persons entitled to vote have at least lowest level tertiary qualifications and 48 per cent of the candidates. (Table 8)
Table 8. Persons entitled to vote, candidates (by party) and elected councillors by educational level in the Municipal elections 2021, %
| Basic level | Upper secondary level | Lowest level tertiary | Lower-degree tertiary | Higher-degree level tertiary, doctorate | |
| Persons ent. to vote | 24.3 | 42.6 | 9.4 | 12.3 | 11.4 |
| Candidates | 10.6 | 41.9 | 11.1 | 16.5 | 19.8 |
| Finnish Social Democratic Party SDP | 11.0 | 47.6 | 11.5 | 14.9 | 14.9 |
| The Finns Party PS |
16.9 | 57.9 | 8.7 | 10.0 | 6.5 |
| National Coalition Party KOK |
8.6 | 30.6 | 13.2 | 19.7 | 27.9 |
| Centre Party of Finland KESK |
7.9 | 39.5 | 14.1 | 19.1 | 19.4 |
| Green League VIHR |
6.3 | 26.5 | 6.5 | 20.4 | 40.2 |
| Left Alliance VAS |
12.3 | 50.4 | 7.4 | 15.3 | 14.6 |
| Swedish Peoples Party in Finland RKP | 8.4 | 29.2 | 9.7 | 21.5 | 31.1 |
| Christian Democrats in Finland KD |
9.3 | 34.7 | 14.5 | 16.5 | 25.0 |
| Movement Now LIIKE |
9.0 | 48.2 | 9.6 | 15.8 | 17.5 |
| Others | 13.5 | 44.1 | 10.5 | 15.3 | 16.6 |
| Elected | 6.8 | 36.5 | 12.9 | 19.0 | 24.9 |
| Male | 9.5 | 43.5 | 12.5 | 14.9 | 19.5 |
| Female | 2.7 | 26.1 | 13.4 | 25.0 | 32.8 |
Green League candidates have clearly the highest level of education. More than 60 per cent of them have tertiary level qualifications, while this is so for 36 per cent of all candidates and for 24 per cent of all persons entitled to vote. Swedish People's Party and National Coalition Party candidates also have more tertiary level qualifications than average for the candidates.
Persons elected to municipals councils are more highly educated than those entitled to vote and the candidates. Of those elected, around 44 per cent have tertiary level qualifications and slightly under seven per cent only have basic level of education. As many as 76 per cent of the Green League’s and 58 per cent of the Coalition Party’s elected councillors have tertiary level qualifications. Among the Finns Party councillors, the share of those with tertiary level qualifications is on level with persons entitled to vote, that is, 24 per cent.
The educational level of the candidates reflects the differences in the educational structure of different areas. In the region of Uusimaa, the proportion of highly educated is higher than in the rest of the country both among the persons entitled to vote and the candidates (Figure 13). In Uusimaa, around 45 per cent of candidates have tertiary level qualifications. In other regions, the share of candidates with tertiary level qualifications is below 40 per cent. The difference between the regions is also clearly visible for the elected councillors. The majority of elected councillors in Uusimaa municipalities, i.e. 57 per cent, have tertiary level qualifications. In other regions, the shares are considerably lower.
Figure 13. Proportion of persons with tertiary level qualifications among persons entitled to vote, candidates and elected councillors by region in Municipal elections 2021, %
1.6. Labour market position
Elected councillors feature strongly in working life
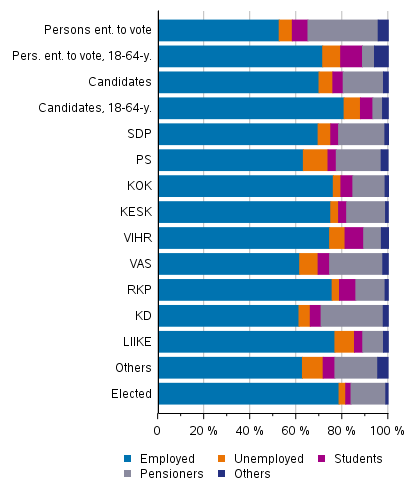
Seventy per cent of the candidates are employed, and the proportion of unemployed persons is the same as among persons entitled to vote, around six per cent. In turn, there are clearly fewer pensioners among the candidates, around 18 per cent. When looking at working-age population (aged 18 to 64), 81 per cent of the candidates are employed, while the proportion of employed persons is nine percentage points lower among all persons entitled to vote. Clearly more of the persons entitled to vote of this age are students and other inactive population than among the candidates. (Figure 14)
Fifty-three per cent of persons entitled to vote are working, six per cent are unemployed and around 31 per cent are pensioners. Seven per cent of persons entitled to vote are studying and around four per cent are otherwise in the inactive population.
The numbers of employed persons are highest among the candidates of the Movement Now party, the National Coalition Party, the Swedish People's Party, the Centre Party and the Green League (75 to 77 per cent). The Green League has most students among its candidates, around eight per cent. The Christian Democrats and the Left Alliance have most pensioner candidates (27% and 23.1%, respectively).
A larger share of those elected to councils (over 80%) are in working life, i.e. employed, than of candidates. Fifteen per cent of elected councillors are retired and three per cent are unemployed.
Figure 14. Persons entitled to vote, candidates (by party) and elected councillors by main type of activity in Municipal elections 2021, %
Employment rate of persons elected to councils 90 per cent
The employment rate is calculated as the ratio of employed persons aged 18 to 64 to the population of the same age. Of all candidates aged 18 to 64, altogether 81 per cent are employed. The employment rate of persons entitled to vote is nine percentage points lower. The employment rates of the candidates resemble the general employment rates in the regions. Where the employment rate of the total population is high, the employment rate of the candidates is also at a high level there. Ostrobothnia has the highest employment rate of total population, 76.2 per cent, and there 85 per cent of the candidates are working. Correspondingly in North Karelia where the general employment rate is lowest in the country, the employment rate of candidates is also lower than the average. (Table 9)
The employment rate of elected councillors is high, 90 per cent for the whole country. It is nine percentage points higher than that of candidates and nearly 20 per cent higher than that of persons entitled to vote. Regional variations were also high. The employment rate of elected councillors varies from 93.6 per cent in South Ostrobothnia to 84.1 per cent in P�ij�t-H�me.
Table 9. Employment rate of persons entitled to vote, candidates and elected councillors (aged 18 to 64) by sex and by region in the Municipal elections 2021, %
| Pers. ent. to vote, 18-64-y. | Candidates, 18-64-y. | Elected 18-64-y. | |||||||
| Total | Male | Female | Total | Male | Female | Total | Male | Female | |
| MAINLAND FINLAND | 71.5 | 70.4 | 72.7 | 80.8 | 80.2 | 81.5 | 90.0 | 90.1 | 89.8 |
| Uusimaa | 73.7 | 73.2 | 74.3 | 82.3 | 81.8 | 82.8 | 90.3 | 89.5 | 91.1 |
| Varsinais-Suomi | 71.8 | 70.7 | 72.9 | 81.2 | 80.8 | 81.6 | 91.4 | 91.3 | 91.5 |
| Satakunta | 71.2 | 69.6 | 72.9 | 83.4 | 83.2 | 83.7 | 91.1 | 90.9 | 91.3 |
| Kanta-H�me | 72.8 | 71.5 | 74.2 | 82.7 | 82.1 | 83.5 | 92.6 | 92.8 | 92.4 |
| Pirkanmaa | 70.8 | 69.8 | 71.8 | 79.0 | 80.2 | 77.3 | 88.4 | 90.9 | 85.4 |
| P�ij�t-H�me | 69.6 | 68.7 | 70.6 | 80.5 | 79.8 | 81.7 | 84.1 | 84.5 | 83.5 |
| Kymenlaakso | 68.4 | 66.5 | 70.4 | 76.7 | 75.9 | 78.1 | 87.4 | 83.5 | 92.6 |
| South Karelia | 68.1 | 65.7 | 70.8 | 79.5 | 78.6 | 81.2 | 89.8 | 88.5 | 91.7 |
| Etel�-Savo | 69.7 | 67.3 | 72.3 | 79.1 | 78.2 | 80.6 | 88.1 | 89.8 | 86.0 |
| Pohjois-Savo | 69.8 | 68.0 | 71.6 | 79.7 | 79.6 | 79.9 | 89.2 | 89.0 | 89.4 |
| North Karelia | 65.5 | 63.4 | 67.8 | 74.8 | 74.6 | 75.2 | 86.6 | 86.5 | 86.9 |
| Central Finland | 67.9 | 66.7 | 69.1 | 77.2 | 75.7 | 79.5 | 88.5 | 89.2 | 87.6 |
| South Ostrobothnia | 73.6 | 72.2 | 75.1 | 83.8 | 83.2 | 84.8 | 93.6 | 93.4 | 94.1 |
| Ostrobothnia | 76.2 | 75.4 | 77.0 | 85.2 | 85.3 | 85.2 | 92.0 | 93.8 | 89.2 |
| Central Ostrobothnia | 73.6 | 73.4 | 73.9 | 83.5 | 83.3 | 83.9 | 91.7 | 91.7 | 91.7 |
| North Ostrobothnia | 69.0 | 68.3 | 69.8 | 79.9 | 79.1 | 81.1 | 89.9 | 90.1 | 89.5 |
| Kainuu | 68.9 | 65.6 | 72.5 | 78.8 | 76.6 | 82.1 | 89.3 | 87.4 | 91.9 |
| Lapland | 70.5 | 68.4 | 72.8 | 81.7 | 79.6 | 84.8 | 91.3 | 90.9 | 91.8 |
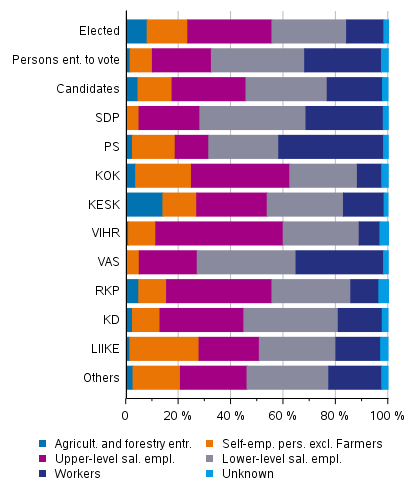
Nearly 30 per cent of all employed candidates and around 20 per cent of employed persons entitled to vote are upper-level employees. Most upper-level employees, nearly one-half of employed candidates, are found in the Green League. Also in the Swedish People’s Party and the Coalition Party, nearly 40 per cent of candidates are upper-level employees. The number of upper-level employees is lowest among the candidates of the Finns Party (13.5%). (Figure 15)
Of all employed candidates, 17.5 per cent are self-employed and of all persons entitled to vote 10.0 per cent. The highest proportions of self-employed persons are found among the candidates of the Movement Now party (27.8%) and the second highest among Centre Party candidates (26.9%), of whom over one half are farmers and forestry entrepreneurs. One-quarter of the Coalition Party candidates are also self-employed, however, focusing more on other self-employed persons than farmers and forestry entrepreneurs. The proportion of workers is highest among the Finns Party candidates, around 40 per cent, and second highest among the Left Alliance candidates, around one third of employed candidates.
For nearly 60 per cent of the elected councillors the socio-economic group is upper-level employees, 14.2 per cent are workers, nine per cent are farmers and forestry entrepreneurs, and 15.5 per cent are other entrepreneurs.
Figure 15. Persons entitled to vote, candidates (by party) and elected councillors by socio-economic group in Municipal elections 2021, %
The public sector and entrepreneurship employ elected councillors more than persons entitled to vote
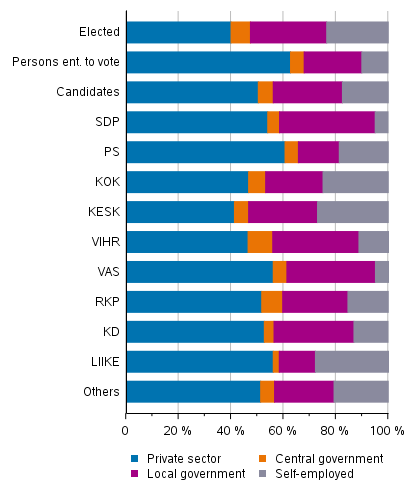
Employed persons can be divided by occupational status into wage and salary earners and entrepreneurs. In addition, wage and salary earners can be further divided according to the employer sector into private sector, central government and local government wage and salary earners. One-half of employed candidates work in the private sector and close on one third in the public sector. Around 18 per cent of the candidates are self-employed.
The employer type varies very much by party. The number of entrepreneurs is highest among the employed candidates of Movement Now, the Centre Party and the Coalition Party, while the number of wage and salary earners in the local government sector is highest among the Social Democratic Party candidates (36.5%). Around one-third of the Left Alliance and Green League candidates also work in the local government sector. Of employed persons entitled to vote, ten per cent are self-employed and around 22 per cent are wage and salary earners in the local government sector.
The highest proportions of central government sector wage and salary earners are found among the candidates of the Green League (9.4%) and the Swedish People's Party (8.0%). Around five per cent of employed persons entitled to vote work in the central government sector. (Figure 16)
Of elected councillors, 29 per cent work in the local government sector. All in all, 7.4 per cent of elected councillors work in the central government sector, 40 per cent in the private sector and 23 per cent as entrepreneurs.
Figure 16. Persons entitled to vote, candidates (by party) and elected councillors by employer sector in Municipal elections 2021, %
The public sector employs candidates most in the largest municipalities with over 50,000 inhabitants. Slightly over one-third of the candidates and nearly one-half of the elected councillors employed in these municipalities work as wage and salary earners in the local or central government sector. In these municipalities, especially the share of candidates and elected councillors working in the central government sector is higher than in smaller municipalities. In small municipalities with fewer than 5,000 inhabitants, the share of self-employed persons among employed candidates is nearly one-quarter and 31 per cent of elected councillors. (Table 10)
Table 10. Candidates and elected councillors by employer sector and size of municipality in Municipal elections 2021, %
| Size category of municipality (population at the end of 2020, %) | ||||||||
| Total | -4,999 | 5,000-9,999 | 10,000-19,999 | 20,000-49,999 | 50,000-99,999 | 100,000+ | ||
| Persons ent. to vote | Private sector | 62.7 | 53.0 | 57.5 | 60.8 | 63.5 | 59.7 | 66.2 |
| Central government | 5.2 | 2.7 | 3.2 | 3.3 | 4.0 | 5.8 | 6.8 | |
| Local government | 22.0 | 25.1 | 24.2 | 23.6 | 22.5 | 25.5 | 19.5 | |
| Self-employed | 10.0 | 19.1 | 15.1 | 12.2 | 10.0 | 9.1 | 7.6 | |
| Candidates | Private sector | 50.4 | 44.0 | 48.0 | 49.9 | 52.6 | 51.5 | 55.8 |
| Central government | 5.7 | 3.4 | 4.1 | 4.1 | 5.6 | 7.8 | 9.6 | |
| Local government | 26.4 | 26.5 | 27.2 | 27.4 | 26.5 | 27.8 | 23.5 | |
| Self-employed | 17.5 | 26.1 | 20.7 | 18.6 | 15.3 | 12.9 | 11.1 | |
| Elected | Private sector | 40.0 | 37.2 | 40.7 | 40.7 | 41.9 | 40.5 | 41.8 |
| Central government | 7.4 | 3.9 | 4.6 | 5.8 | 9.3 | 13.1 | 23.2 | |
| Local government | 29.1 | 28.0 | 28.6 | 30.0 | 30.4 | 33.1 | 26.0 | |
| Self-employed | 23.5 | 30.9 | 26.1 | 23.5 | 18.4 | 13.3 | 9.0 | |
1.7. Family status
Forty per cent of elected councillors are parents of a family with children
The candidates also differ in their family status from the persons entitled to vote: considerably more (34%) of the candidates are parents of a family with children than among persons entitled to vote (22%) and fewer candidates live alone (21%) than persons entitled to vote (28%). There are also fewer young people living at home among the candidates. Differences in the family status are explained by the fact that the age structure of the candidates and persons entitled to vote differs from each other. Both the bottom and top ends of the age range are missing among the candidates. For a large part of persons entitled to vote, children have already moved away from home, while most candidates are at an age when children are still living at home. (Figure 17, Table 11)
The Green League has the most candidates that are parents of a family with children, 43 per cent. The Left Alliance has the least candidates that still have children aged under 18 living at home. The Swedish People’s Party has the most young people aged under 25 still living at home (4.5%) and the Left Alliance has the most persons living alone (28.5%) among their candidates.
Of the elected councillors, nearly 40 per cent are parents of a family with children, which is more than the average for candidates and persons entitled to vote. By contrast, there are clearly fewer persons living alone among the elected councillors (13.6%) than among persons entitled to vote of whom over one quarter are living alone. The Green League has the most candidates that are parents of a family, nearly 52 per cent. The Left Alliance has the least elected councillors that are parents of a family, around 33 per cent.
Figure 17. Persons entitled to vote, candidates (by party) and elected councillors by family status in Municipal elections 2021, %
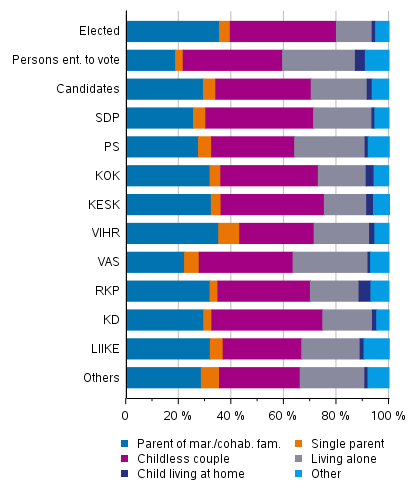
Table 11. Persons entitled to vote, candidates and elected councillors by party and by family status in the Municipal elections 2021, %
| Parent of mar./cohab. fam. | Single parent | Childless couple | Living alone | Child living at home | Other | ||
| Persons ent. to vote | 18.8 | 2.9 | 37.8 | 27.7 | 3.8 | 9.0 | |
| Candidates | Candidates | 29.4 | 4.7 | 36.3 | 21.3 | 1.9 | 6.3 |
| Centre Party of Finland KESK |
32.4 | 3.7 | 39.3 | 16.1 | 2.6 | 6.1 | |
| National Coalition Party KOK |
31.9 | 4.1 | 37.1 | 18.2 | 3.0 | 5.6 | |
| Finnish Social Democratic Party SDP |
25.6 | 4.7 | 41.0 | 22.2 | 1.1 | 5.4 | |
| Left Alliance VAS |
22.2 | 5.6 | 35.7 | 28.5 | 1.0 | 7.0 | |
| Green League VIHR |
35.2 | 8.0 | 28.3 | 21.1 | 2.0 | 5.4 | |
| Christian Democrats in Finland KD | 29.5 | 3.1 | 42.2 | 18.9 | 1.6 | 4.7 | |
| Swedish Peoples Party in Finland RKP |
31.9 | 3.0 | 35.2 | 18.5 | 4.5 | 6.9 | |
| The Finns Party PS |
27.5 | 5.0 | 31.6 | 26.8 | 1.2 | 8.0 | |
| Movement Now LIIKE |
32.0 | 4.9 | 29.9 | 22.2 | 1.5 | 9.6 | |
| Others | 28.6 | 6.9 | 30.7 | 24.6 | 1.2 | 8.0 | |
| Elected | Elected | 35.5 | 4.1 | 40.4 | 13.6 | 1.3 | 5.1 |
| Centre Party of Finland KESK |
36.9 | 2.8 | 43.0 | 10.8 | 1.6 | 4.9 | |
| National Coalition Party KOK |
38.3 | 3.4 | 38.9 | 12.6 | 1.8 | 5.0 | |
| Finnish Social Democratic Party SDP |
29.2 | 4.9 | 46.7 | 14.0 | 0.7 | 4.6 | |
| Left Alliance VAS |
27.6 | 4.9 | 44.1 | 18.3 | 0.8 | 4.3 | |
| Green League VIHR |
43.9 | 7.9 | 24.9 | 14.5 | 2.5 | 6.2 | |
| Christian Democrats in Finland KD | 33.8 | 2.3 | 53.7 | 9.0 | - | 1.3 | |
| Swedish Peoples Party in Finland RKP |
36.5 | 1.9 | 42.1 | 11.2 | 1.9 | 6.3 | |
| The Finns Party PS |
35.8 | 5.5 | 32.7 | 18.7 | 0.6 | 6.7 | |
| Movement Now LIIKE |
40.8 | 4.1 | 34.7 | 14.3 | - | 6.1 | |
| Others | 39.2 | 6.4 | 32.8 | 14.9 | 0.7 | 6.1 | |
Family status does not reveal how many have or have had children of their own, because in older families, children may have already moved away from home and in family break-ups, children may live with their other parent. This can, however, be examined based on the number of children recorded in the Finnish Population Information System.
Candidates and elected councillors have more children than average. Around 78 per cent of the candidates and 85 per cent of the elected councillors have children of their own. The corresponding share for persons entitled to vote is 65 per cent. Children are the most numerous among the Christian Democrats, of whom 24 per cent have at least four children, and among the Centre Party candidates, of whom 19 per cent have four or more children. Large families are rarer for the Green League candidates (Figure 18).
In all, 36 per cent of the persons entitled to vote and 22 per cent of the candidates have never had or do not yet have children of their own. The proportion of childless candidates varies from 18 per cent for the Christian Democrats to 30 per cent for the Green League.
Figure 18. Persons entitled to vote, candidates (by party) and elected councillors by number of children in Municipal elections 2021, %
On average, the candidates have two children. All persons entitled to vote have an average of 1.5 children. The number of children is highest among the Christian Democrat candidates, 2.5 children and among the Centre Party candidates, 2.4 children. The Green League candidates have the lowest number of children, 1.6. Men entitled to vote have slightly fewer children than women, but there are not much of a difference between sexes among the candidates. (Table 12)
Elected councillors have an average of 2.3 children. The number of children is highest among the Christian Democrat candidates, 3.1 children, on average, and lowest among the Green League candidates, 1.7 children.
Table 12. Persons entitled to vote, candidates and elected councillors by party and by number of children (on average) in the Municipal elections 2021
| Total | Male | Female | ||
| Persons ent. to vote | 1.5 | 1.4 | 1.6 | |
| Candidates | Candidates | 2.0 | 2.0 | 2.0 |
| Centre Party of Finland KESK | 2.4 | 2.4 | 2.4 | |
| National Coalition Party KOK | 1.9 | 1.9 | 1.9 | |
| Finnish Social Democratic Party SDP | 1.9 | 1.8 | 2.0 | |
| Left Alliance VAS | 1.7 | 1.7 | 1.7 | |
| Green League VIHR | 1.6 | 1.5 | 1.6 | |
| Christian Democrats in Finland KD | 2.5 | 2.5 | 2.4 | |
| Swedish Peoples Party in Finland RKP | 1.8 | 1.8 | 1.7 | |
| The Finns Party PS | 2.0 | 1.9 | 2.2 | |
| Movement Now LIIKE | 1.7 | 1.7 | 1.8 | |
| Others | 1.9 | 1.8 | 2.0 | |
| Elected | Elected | 2.3 | 2.3 | 2.2 |
| Centre Party of Finland KESK | 2.7 | 2.7 | 2.6 | |
| National Coalition Party KOK | 2.1 | 2.1 | 2.1 | |
| Finnish Social Democratic Party SDP | 2.1 | 2.1 | 2.1 | |
| Left Alliance VAS | 2.0 | 2.1 | 1.9 | |
| Green League VIHR | 1.7 | 1.7 | 1.7 | |
| Christian Democrats in Finland KD | 3.1 | 3.4 | 2.7 | |
| Swedish Peoples Party in Finland RKP | 2.0 | 2.0 | 2.1 | |
| The Finns Party PS | 2.2 | 2.2 | 2.2 | |
| Movement Now LIIKE | 2.1 | 2.2 | 2.0 | |
| Others | 2.4 | 2.5 | 2.3 | |
1.8. Income level
Income level of the candidates and elected councillors higher than that of persons entitled to vote
The following examines the persons entitled to vote and the candidates by their disposable income. Income data derive from the latest confirmed taxation from 2019. Disposable monetary income refers to the monetary income after taxes that consists of earned income, property income, and transfer income.
Candidates and elected councillors are more highly educated and a larger share of them are also working than among persons entitled to vote. This partly explains why their income level is also higher than that of persons entitled to vote. The median disposable income of persons entitled to vote was EUR 22,300 in 2019, while that of candidates was EUR 28,400 and of elected councillors EUR 33,700. The candidates' disposable income is, on average, 27 per cent higher than that of persons entitled to vote. Disposable income is highest in Uusimaa both for persons entitled to vote (EUR 24,900 per year), candidates (EUR 31,100 per year) and elected councillors (EUR 39,400 per year). (Table 13)
In euros, the income differential between the candidates and persons entitled to vote is largest in South Karelia, where the median income of the candidates is over EUR 8,500 higher than that of persons entitled to vote. In Satakunta, South Savo, P�ij�t-H�me and Kanta-H�me the candidates' median income is also over EUR 7,000 higher than that of persons entitled to vote. Income differentials are smallest in Lapland, Central Ostrobothnia and North Savo, under EUR 6,000.
Table 13. Median disposable income (EUR per year) of persons entitled to vote, candidates and elected councillors by region in the Municipal elections 2021
| Persons entit. to vote | Candidates | Elected | |||||||
| Total | Male | Female | Total | Male | Female | Total | Male | Female | |
| MAINLAND FINLAND | 22,300 | 24,200 | 20,800 | 28,400 | 29,000 | 27,700 | 33,700 | 34,900 | 32,100 |
| Uusimaa | 24,900 | 26,900 | 23,400 | 31,100 | 31,900 | 30,100 | 39,400 | 41,600 | 37,900 |
| Varsinais-Suomi | 21,900 | 23,800 | 20,400 | 28,600 | 29,800 | 27,500 | 34,200 | 36,200 | 32,400 |
| Satakunta | 21,300 | 23,500 | 19,600 | 28,900 | 29,800 | 28,000 | 33,400 | 35,100 | 31,400 |
| Kanta-H�me | 22,200 | 24,200 | 20,600 | 29,400 | 29,600 | 29,000 | 35,300 | 36,100 | 34,100 |
| Pirkanmaa | 21,700 | 23,800 | 20,200 | 27,900 | 29,000 | 26,400 | 33,400 | 35,900 | 31,500 |
| P�ij�t-H�me | 21,300 | 23,300 | 19,800 | 28,700 | 29,000 | 27,700 | 35,400 | 37,800 | 32,300 |
| Kymenlaakso | 21,200 | 23,600 | 19,300 | 27,700 | 28,500 | 26,500 | 35,000 | 35,400 | 33,700 |
| South Karelia | 20,800 | 23,000 | 19,200 | 29,300 | 29,800 | 28,300 | 34,900 | 36,200 | 33,100 |
| Etel�-Savo | 20,200 | 21,500 | 19,200 | 27,700 | 27,900 | 27,100 | 31,300 | 31,600 | 30,600 |
| Pohjois-Savo | 20,900 | 22,400 | 19,700 | 26,800 | 26,900 | 26,400 | 31,800 | 32,900 | 30,600 |
| North Karelia | 19,600 | 20,700 | 18,700 | 25,700 | 25,800 | 25,100 | 30,900 | 32,500 | 28,600 |
| Central Finland | 20,800 | 22,700 | 19,400 | 26,800 | 27,200 | 26,500 | 32,100 | 33,400 | 31,000 |
| South Ostrobothnia | 21,100 | 22,700 | 19,700 | 28,000 | 28,500 | 27,500 | 33,600 | 34,700 | 31,000 |
| Ostrobothnia | 22,000 | 24,300 | 20,100 | 28,300 | 29,600 | 26,800 | 33,200 | 34,700 | 30,800 |
| Central Ostrobothnia | 21,500 | 23,700 | 19,700 | 27,300 | 28,100 | 26,900 | 31,400 | 31,500 | 31,000 |
| North Ostrobothnia | 21,700 | 23,500 | 20,200 | 27,700 | 28,300 | 27,000 | 32,200 | 34,100 | 30,900 |
| Kainuu | 20,600 | 22,000 | 19,400 | 27,200 | 27,600 | 26,500 | 30,900 | 31,000 | 30,300 |
| Lapland | 21,400 | 22,800 | 20,300 | 27,100 | 27,600 | 26,700 | 31,600 | 33,300 | 29,600 |
The median for the candidates’ disposable monetary income varies by party from EUR 33,900 in the Coalition Party to EUR 25,100 in the Left Alliance. The median income of the Swedish People’s Party candidates is EUR 31,500 and that of the Centre Party 30,000. Compared with persons entitled to vote, the candidates of the Coalition Party have over EUR 11,000 more at their disposal per year. The candidates for the Left Alliance are closest to persons entitled to vote in terms of their income level. Their annual disposable income is EUR 2,800 higher than that of persons entitled to vote. (Table 14)
The median disposable income of elected councillors is EUR 33,700 per year, which is over EUR 11,000 more than the median income of persons entitled to vote. Future councillors from the Coalition Party have the highest income. On average, they have EUR 41,100 per year at their disposal. The councillors elected from the Left Alliance have the lowest income. The median for their disposable monetary income is around EUR 29,300 per year.
Table 14. Median disposable income (EUR per year) of persons entitled to vote, candidates and elected councillors by party in the Municipal elections 2021
| Total | Male | Female | ||
| Persons ent. to vote | 22,300 | 24,200 | 20,800 | |
| Candidates | Candidates | 28,400 | 29,000 | 27,700 |
| Centre Party of Finland KESK | 30,000 | 31,300 | 28,600 | |
| National Coalition Party KOK | 33,900 | 35,900 | 31,800 | |
| Finnish Social Democratic Party SDP | 28,700 | 29,200 | 28,000 | |
| Left Alliance VAS | 25,100 | 25,100 | 25,100 | |
| Green League VIHR | 28,700 | 29,300 | 28,300 | |
| Christian Democrats in Finland KD | 25,800 | 26,300 | 25,200 | |
| Swedish Peoples Party in Finland RKP | 31,500 | 33,700 | 29,400 | |
| The Finns Party PS | 25,400 | 25,900 | 23,600 | |
| Movement Now LIIKE | 29,000 | 30,000 | 26,100 | |
| Others | 25,200 | 25,700 | 24,500 | |
| Elected | Elected | 33,700 | 34,900 | 32,100 |
| Centre Party of Finland KESK | 33,800 | 35,600 | 31,600 | |
| National Coalition Party KOK | 41,100 | 43,900 | 37,700 | |
| Finnish Social Democratic Party SDP | 32,400 | 33,200 | 31,400 | |
| Left Alliance VAS | 29,300 | 29,700 | 29,000 | |
| Green League VIHR | 34,800 | 36,600 | 34,400 | |
| Christian Democrats in Finland KD | 33,100 | 34,500 | 30,000 | |
| Swedish Peoples Party in Finland RKP | 35,400 | 37,200 | 32,600 | |
| The Finns Party PS | 30,200 | 30,700 | 28,600 | |
| Movement Now LIIKE | 39,900 | 40,700 | 37,400 | |
| Others | 32,600 | 33,600 | 31,300 | |
When the population entitled to vote is arranged according to income and divided into ten equal parts, the income deciles of the population entitled to vote are generated. Each of these has slightly under 440,000 persons. The highest income decile of the population entitled to vote has at least EUR 41,400 at their disposal and the lowest income decile at most EUR 9,400.
Among all candidates, 18 per cent belong to the highest income decile and of the elected councillors nearly 30 per cent. The Coalition Party candidates and elected councillors were at the higher end of the income distribution. Thirty-seven per cent of male Coalition Party candidates and 25 per cent of female candidates belong to the highest income decile. Among the candidates of the Swedish People's Party, around 32 per cent of men and 19 per cent of women belong to the highest income decile. Nearly one-half of those elected from the Coalition Party belong to the highest income decile and around one-third of elected councillors from the Swedish People's Party. Around 47 per cent of the elected councillors from Movement Now belonged to the highest income decile, although the share of the candidates was under one quarter. (Figure 19)
There are fewer women in the highest income decile among persons entitled to vote, candidates and elected councillors. The biggest difference between sexes is found among the Movement Now, Swedish People's Party, the Coalition Party and the Centre Party candidates. In these parties, there are over ten percentage points more men in the highest income decile than women. The difference is smallest among Left Alliance candidates where around three percentage points more men than women belong to the highest income decile. Around one-third of the elected men belong to the highest income decile and close on one-quarter of the elected women.
Figure 19. Candidates and elected councillors (by party) belonging to the highest income decile in Municipal elections 2021, % of the party’s candidates (disposable monetary income)
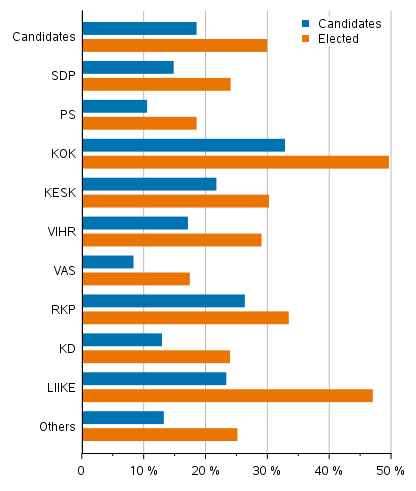
Slightly under six per cent of the candidates belong to the lowest income decile. Examined by party, the highest proportion of candidates belong to the lowest income decile in Movement Now and the Green League, slightly over eight per cent. The Social Democrats have the least candidates belonging to the lowest income decile, slightly over three per cent. (Figure 20)
In the lowest income decile the share of men is also higher than that of women both among persons entitled to vote and candidates. A larger share of female candidates than male candidates belong to the lowest income decile only among Left Alliance, Swedish People’s Party and Movement Now candidates. However, the difference between sexes is not as large as in the shares of those belonging to the highest income decile.
Only around three per cent of the elected councillors belong to the lowest income decile. Although a majority of the elected councillors from Movement Now belonged to the highest income decile, they are also more numerous in the lowest income decile than on average among the elected councillors or candidates. Around ten per cent of the elected councillors of Movement Now belong to the lowest income decile, which is the same as among persons entitled to vote.
Figure 20. Candidates and elected councillors (by party) belonging to the lowest income decile in Municipal elections 2021, % of the party’s candidates (disposable monetary income)
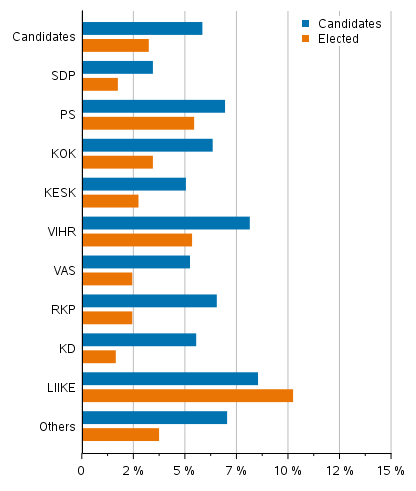
Source: Municipal Elections 2021, background analysis of candidates and elected councillors, Statistics Finland
Inquiries: Sami Fredriksson 029 551 2696, Kaija Ruotsalainen 029 551 3599, Jaana Asikainen 029 551 3506, vaalit@stat.fi
Head of Department in charge: Hannele Orjala
Updated 24.06.2021
Official Statistics of Finland (OSF):
Municipal elections [e-publication].
ISSN=2323-1114. confirmed result 2021,
1. Background analysis of candidates and elected councillors in Municipal elections 2021
. Helsinki: Statistics Finland [referred: 26.7.2026].
Access method: http://stat.fi/til/kvaa/2021/04/kvaa_2021_04_2021-06-24_kat_001_en.html