

Published: 24 June 2021
Altogether 43.9 per cent of councillors elected in Municipal elections 2021 are new municipal councillors
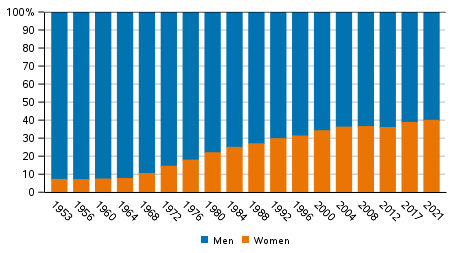
A total of 8,859 councillors were elected to municipal and town councils in the Municipal elections 2021. Of the elected representatives, 43.9 per cent were new councillors. Of the elected councillors, 40.2 per cent were women, which is 1.2 percentage points more than in the previous elections.
Men and women as percentage of elected councillors in Municipal elections 1953-2021, %
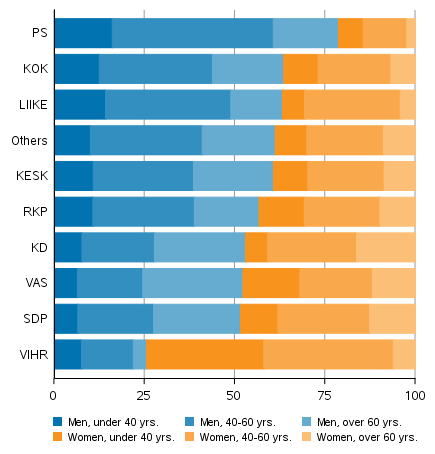
Of the parliamentary parties, the Green League has the most female councillors elected in the Municipal elections, 74.1 per cent, and the Finns Party has the least, 21.1 per cent. The average age of elected councillors in the 2021 elections was 50.8 years, that of elected women 48.2 years and that of men 52.6 years. The average age of new councillors was lowest for the Green League (42.9 years) and highest for the Christian Democrats (54.9 years).
Share of men and women among the elected by party and age in Municipal elections 2021, %
Current councillors made up 56.1 per cent of all elected councillors. The proportion of Finnish speakers and Sami speakers among new councillors was 92.8 per cent, that of Swedish speakers 6.3 per cent and that of persons not speaking national languages 0.8 per cent. Of the elected councillors 78.6 per cent were employed and 18.5 per cent were in the inactive population. The median for the disposable monetary income of all elected councillors was EUR 33,700.
Table 1. Background analysis of elected councillors by party in the Municipal elections 2021
| Memb. of Parl. (%) |
Counc. in municipal councils (%) |
Average age |
Finn. or Sami speakers (%) |
Swedish speakers (%) |
Other lang. speakers (%) |
Employed (%) | Unemployed (%) | In inactive pop. (%) |
Avg. income |
|
| Total | 2.0 | 56.1 | 50.8 | 92.8 | 6.3 | 0.8 | 78.6 | 2.9 | 18.5 | 33,700 |
| SDP | 2.5 | 66.9 | 53.4 | 95.5 | 3.0 | 1.5 | 73.7 | 3.4 | 22.9 | 32,400 |
| PS | 2.6 | 37.6 | 49.0 | 98.8 | 0.4 | 0.8 | 76.8 | 5.8 | 17.3 | 30,200 |
| KOK | 2.1 | 55.3 | 50.2 | 98.2 | 1.2 | 0.6 | 81.0 | 1.5 | 17.5 | 41,100 |
| KESK | 1.0 | 59.3 | 51.3 | 99.8 | 0.1 | 0.1 | 81.3 | 2.1 | 16.6 | 33,800 |
| VIHR | 3.7 | 51.5 | 42.9 | 96.1 | 1.4 | 2.5 | 82.4 | 4.2 | 13.4 | 34,800 |
| VAS | 2.8 | 66.5 | 52.3 | 96.9 | 1.2 | 2.0 | 69.9 | 4.7 | 25.4 | 29,300 |
| RKP | 1.9 | 59.2 | 50.0 | 5.8 | 93.1 | 1.1 | 83.2 | 0.4 | 16.4 | 35,400 |
| KD | 1.6 | 56.3 | 54.9 | 88.1 | 11.6 | 0.3 | 74.9 | 1.0 | 24.1 | 33,100 |
| LIIKE | 2.0 | 26.5 | 49.2 | 91.8 | 8.2 | - | 83.7 | 2.0 | 14.3 | 39,900 |
| Others | - | 54.4 | 51.0 | 95.9 | 3.0 | 1.0 | 80.7 | 2.7 | 16.6 | 32,600 |
More detailed data on the candidates and elected councillors of the Municipal elections can be found in the review: Background analysis of candidates and elected councillors in Municipal elections 2021.
Source: Municipal Elections 2021, background analysis of candidates and elected councillors, Statistics Finland
Inquiries: Sami Fredriksson 029 551 2696, Kaija Ruotsalainen 029 551 3599, Jaana Asikainen 029 551 3506, vaalit@stat.fi
Head of Department in charge: Hannele Orjala
Publication in pdf-format (1.0 MB)
- Reviews
- Tables
-
Tables in databases
Pick the data you need into tables, view the data as graphs, or download the data for your use.
- Quality descriptions
-
- Municipal elections, quality description (24.6.2021)
Updated 24.06.2021
Official Statistics of Finland (OSF):
Municipal elections [e-publication].
ISSN=2323-1114. confirmed result 2021. Helsinki: Statistics Finland [referred: 15.7.2026].
Access method: http://stat.fi/til/kvaa/2021/04/kvaa_2021_04_2021-06-24_tie_001_en.html