Pay differentials also within educational levels between fields of education
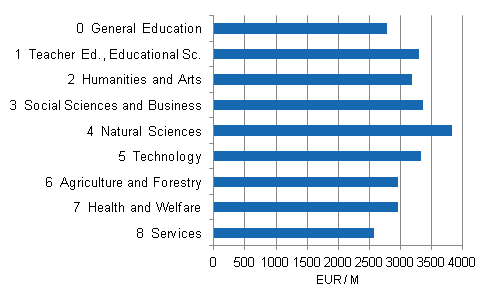
According to Statistics Finland's structure of earnings statistics the highest average monthly pay, EUR 3,842, was found among full-time wage and salary earners with education in natural sciences. The second highest average monthly pay was earned by persons with education in business and technology. The lowest average pay, EUR 2,576, was received by persons educated in service industries. The average pay among completers of general comprehensive education was EUR 2,776.Figure 1. Average monthly pay of full-time wage and salary earners by fields of education in 2011

When fields of education are grouped by educational level, clear differences are found between average pays. The average monthly pay of those with lowest level tertiary qualifications in natural sciences (data processing), EUR 4,232, is clearly higher than for other wage and salary earners with the same level of education. In contrast, the average pay of those with higher university level degrees or doctorate level degrees in natural sciences was at the bottom of their level of education. In higher education levels, the highest average pays were received by people with education in the field of health and welfare. Among wage and salary earners with higher education levels, the lowest average pays were received by those with humanities and art education.
Table 1. Average monthly pay of full-time wage and salary earners by fields of education and educational levels in 2011
| Classification of Education | Educational level | ||||
| Upper Secondary Level Ed. | Lowest Level Tertiary Ed. | Lower-Degree Level Tert. Ed. | Higher-Degree Level Tert. Ed. | Doctorate Level Tertiary Ed. | |
| 1 Teacher Ed., Educational Sc. | 2 993 | 2 891 | 2 940 | 3 521 | 4 703 |
| 2 Humanities and Arts | 2 441 | 2 887 | 2 868 | 3 491 | 4 371 |
| 3 Social Sciences and Business | 2 612 | 3 077 | 3 269 | 4 678 | 5 174 |
| 4 Natural Sciences | 2 856 | 4 232 | 3 691 | 3 961 | 4 564 |
| 5 Technology | 2 866 | 3 677 | 3 870 | 4 691 | 5 274 |
| 6 Agriculture and Forestry | 2 538 | 3 064 | 3 026 | 4 223 | 4 822 |
| 7 Health and Welfare | 2 408 | 3 002 | 2 749 | 5 534 | 6 671 |
| 8 Services | 2 399 | 3 187 | 2 991 | 4 245 | 4 777 |
Source: Structure of Earnings 2011, Statistics Finland
Inquiries: Sampo Pehkonen 09 1734 3452, Mika Idman 09 1734 3445, palkkarakenne@stat.fi
Director in charge: Hannele Orjala
Updated 7.5.2013
Official Statistics of Finland (OSF):
Structure of Earnings [e-publication].
ISSN=1799-0092. 2011,
Pay differentials also within educational levels between fields of education
. Helsinki: Statistics Finland [referred: 7.2.2026].
Access method: http://stat.fi/til/pra/2011/pra_2011_2013-04-05_kat_001_en.html

