Published: 20 March 2020
Biggest earnings in male-dominated industries in 2018
According to Statistics Finland’s Structure of Earnings statistics, wage and salary earners' average earnings were typically higher in male-dominated industries than in female-dominated ones. The difference between earnings was particularly clear for wage and salary earners working as technicians and associate professionals.
Total earnings of full-time technicians and associate professionals by the industry's male share in 2018
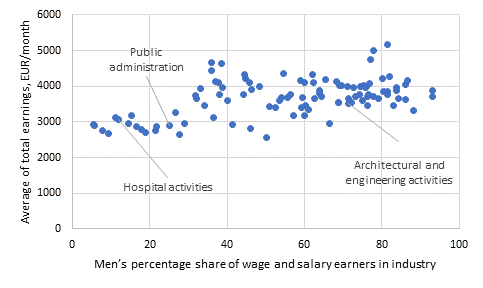
The average earnings were EUR 3,152 in those industries where under 50 per cent of technicians and associate professionals in full-time work were women. Correspondingly, in industries where over 50 per cent of technicians and associate professionals were men, the average of total earnings was EUR 3,836 in 2018.
Among individual industries, technicians and associate professionals worked most in hospital activities and public administration. In these female-dominated industries the average earnings of full-time technicians and associate professionals were EUR 3,080 and EUR 2,906 per month in 2018. The most typical occupational titles in the industries were nurses, government tax and excise officials and social work associate professionals.
Large male-dominated fields are architectural and engineering activities and software consultancy services, where the average earnings of full-time professionals were EUR 3,517 and EUR 3,991 per month. The most common occupation categories of the industries were mechanical engineering technicians and user support technicians and operations technicians.
Industries are examined in this release on the 3-digit level of the official Standard Industrial Classification 2008 , which divides the industries into 303 groups. The smallest industries of under 500 wage and salary earners are excluded from the examination in this release. The industry is determined according to the main activity of the wage and salary earner's workplace.
Similar relationship among professionals
The average earnings of professionals, or wage and salary earners whose work is classified as more demanding than that of technicians and associate professionals, were also typically bigger in those industries where more men are working.
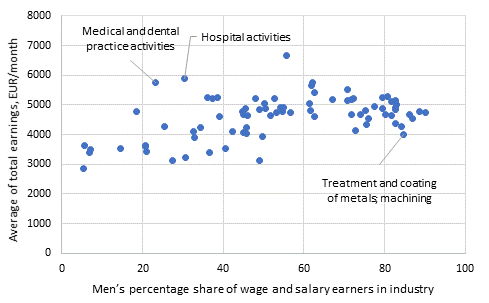
If men made up more than 50 per cent of the professionals in the industry in 2018, the average of total earnings in the occupational group was EUR 4,774 per month. The corresponding figure for full-time professionals in female-dominated industries was EUR 4,116.
Among professionals, two industries differ from this tendency, hospital activities and medical and dental practice activities. In these industries the share of women was bigger than that of men, and the averages of total earnings were typically more substantial, EUR 5,902 and EUR 5,753 per month. This is caused by that there are plenty of doctors working in these industries and that 60 per cent of doctors were women.
Total earnings of full-time professionals by the industry's (3-digit level) male share in 2018
Earnings biggest for office and customer service workers and shop sales workers in male-dominated fields
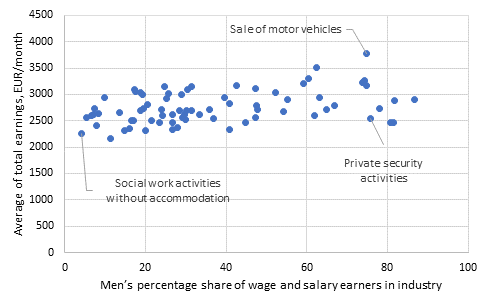
The earnings of office and customer service workers and shop sales workers in full-time work were at their largest in male-dominated industries. For example, the average earnings of full-time office and customer service workers and shop sales workers employed in sale of motor vehicles was EUR 3,783 per month. This industry has a large number of salespersons paid on commission for whom the taxation value of fringe benefits is clearly higher than average.
In the most female-dominated industry of office and customer service workers and shop sales workers, in social work activities without accommodation, the earnings of these occupational groups in full-time work were EUR 2,254 per month, on average, in 2018. The industry of social work activities without accommodation includes children's day care centres, social work related to families and outpatient rehabilitation for intoxicant abusers. The most common occupational group of the industry is child care worker.
Total earnings of full-time office and customer service workers and shop sales workers by the industry's (3-digit level) male share in 2018
Plant and machine operators and assemblers, and craft and related trades workers had hardly any female-dominated fields
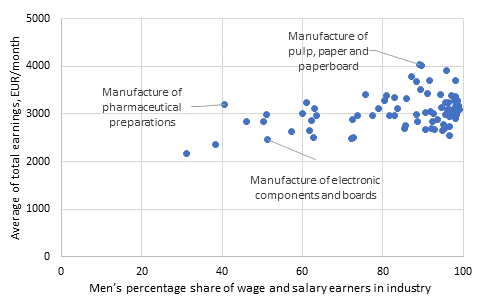
The wage and salary earners who worked as plant and machine operators and assemblers, and craft and related trades workers had only four female-dominated industries in 2018. In turn, there were 73 male-dominated industries including over 500 wage and salary earners in the occupational groups concerned.
The average earnings of plant and machine operators and assemblers, and craft and related trades workers rose as the male share grew. Full-time workers in these occupations had the biggest earnings in the manufacture of pulp, paper and paperboard, EUR 4,026.
It is vital to notice that the higher average earnings of male-dominated fields are not explained for any main level of the Classification of Occupations by the amount of shift or overtime work. Slightly more overtime work was made in male-dominated industries in 2018, but monetary compensations paid for shift work in female-dominated fields were clearly larger.
Total earnings for full-time plant and machine operators and assemblers, and craft and related trades workers by the industry's (3-digit level) male share in 2018
Pay differential between women and men bigger in male-dominated industries
The figure below shows pay differentials between women and men by industry in 2018. The pay differential was calculated by comparing the total earnings of full-time wage and salary earners on the main levels of the Classification of Occupations (e.g. professionals, technicians and associate professionals and service and sales workers) and by weighting these differentials together into one industry-specific key figure by the numbers of wage and salary earners. Positive figures refer to a pay differential in favour of women and negative figures in favour of men.
Pay differential of full-time women and men on the main level of the Classification of Occupations by industry (3-digit level) calculated from the average for total earnings in 2018
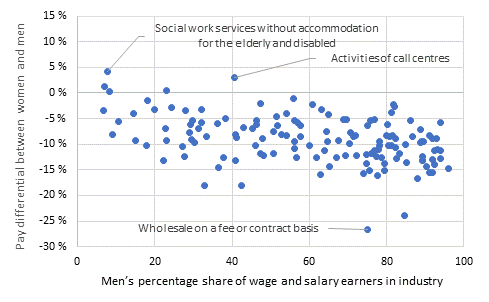
Those industries where under 50 per cent of wage and salary earners in full-time work were men, women's total earnings were, on average, 6.4 per cent lower than men's total earnings. Correspondingly, in industries where over 50 per cent of wage and salary earners were men, women's earnings were, on average, 10 per cent lower.
If women's and men's pay differentials are examined by industry and on the most detailed level of the Classification of Occupations, that is, the comparison would be made between around 500 occupational groups instead of 10, the pay differential narrows down. According to the comparison, women’s earnings were 6.7 per cent lower than men's, on average.
This means two things. Women were working within the main groups of the Classification of Occupations (e.g. professionals, technicians and associate professionals) in such occupations where the earnings level is lower. On the other hand, even if pay differentials were compared on the most detailed level of the Classification of Occupations and by industry, women's earnings are still, on average, 6.7 per cent lower than men's earnings.
If the pay differential examination were further specified and taken to the level of occupational titles actually present in working life, it would narrow down further. It should be noted that this indicates that even on the most detailed levels of the official Classification of Occupations, which compiles occupational titles present in working life into groups, women work in groups where the earnings level is lower.
Structure of Earnings statistics describe 1.4 million full-time wage and salary earners
The Structure of Earnings statistics for 2018 provide data on the earnings of around full–time 1.39 million wage and salary earners. There were 1.67 million full-time and part-time employees combined in 2018. The data in the statistics are collected from monthly-paid wage and salary earners for September, October or November, and from hourly-paid wage and salary earners for the last quarter of the year. This publication supplements the preliminary data on the Structure of Earnings statistics released on 6 September 2019 with industry and region-specific earnings data.
The Structure of Earnings statistics measure total earnings. Apart from basic pay, total earnings also include pay for personal supplements, premium pays, supplement for location and adverse working conditions, supplements based on duties, professional skill and years of service, performance-based pay components, partly compensation for standby and on-call work, pay for hours not worked, overtime and working hour supplements, and benefits in kind. Total earnings do not include one-off pay items, such as performance-based bonuses and holiday bonuses.
Source: Structure of Earnings 2018, Statistics Finland
Inquiries: Sampo Pehkonen 029 551 3452, Jukka Pitkäjärvi 029 551 3356, palkkarakenne@stat.fi
Director in charge: Mari Ylä-Jarkko
Publication in pdf-format (265.6 kB)
- Tables
-
Tables in databases
Pick the data you need into tables, view the data as graphs, or download the data for your use.
Appendix tables
Updated 20.3.2020
Official Statistics of Finland (OSF):
Structure of Earnings [e-publication].
ISSN=1799-0092. 2018. Helsinki: Statistics Finland [referred: 15.2.2026].
Access method: http://stat.fi/til/pra/2018/pra_2018_2020-03-20_tie_001_en.html

