

Published: 27 August 2021
Passenger traffic by rail decreased in Finland in 2020
In 2020, nearly 59.5 million trips in passenger traffic were made by Finnish rail and 38.4 million tonnes of freight were transported. The number of trips in passenger traffic fell by 36 per cent and the volume of freight transported was unchanged from the previous year.
Number of trips in long-distance and local traffic in years 2009–2020
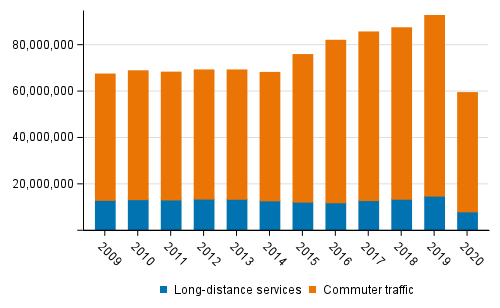
Number of trips in passenger traffic fell by 36 per cent
In 2020, the total number of trips in passenger traffic by rail totalled 59.5 million, which was 33.3 million less than in 2019. The number of trips fell by 36 per cent from 2019.
Of trips, 86 per cent were made in local traffic and 14 per cent in long-distance traffic. The number of trips in local traffic fell by 34 per cent and in long-distance traffic by 45 per cent from the previous year.
Of the trips made in long-distance traffic, 8 million were made in Finland and 0.1 million in international traffic. The average length of trips was 47 kilometres, which was 11 per cent shorter than in the year before.
In 2020, the number of passenger-kilometres in train traffic decreased by 43 per cent from the previous year. Passenger-kilometres totalled 2.8 billion, of which long-distance traffic accounted for 73 per cent and local traffic for 23 per cent.
Volume of freight transported stayed the same
A total of 38.4 million tonnes of freight were transported by rail in Finland in 2020. The volume of freight transported remained the same from 2019. The transport performance of freight transported by rail totalled 10.1 billion tonne-kilometres, which was one per cent less than in 2019. Of tonne-kilometres, 66 per cent came from domestic traffic and 34 per cent from international traffic. The average length of a freight transport journey was 264 kilometres, which was one per cent shorter than in the previous year.
Wood and wood products were transported most by rail, amounting to 14.6 million tonnes last year. The share of the product group was 38 per cent of all transported tonnes. Mineral products were transported second most, in total 8.5 million tonnes, followed by 6.6 million tonnes of paper industry products. The transport performance was highest in the transport of wood and wood products, 3.4 billion tonne-kilometres, which was 33 per cent of all transport.
Train traffic performances
The total number of train-kilometres was 47.7 million train-kilometres in 2020. Train kilometres in passenger traffic by rail decreased by eight per cent and passenger traffic accounted for 71 per cent of all train-kilometres. Train-kilometres in freight traffic diminished by five per cent in 2020.
The share of the electric tractive stock in train-kilometres decreased and in 2020, the share of the electric tractive stock was 89 per cent of train-kilometres. The train-kilometres of electric locomotives fell by nine per cent and train kilometres of electric railcars fell by five per cent from 2020. The share of electric locomotives in the train-kilometres of the electric tractive stock was 59 per cent.
In 2020, locomotive-kilometres totalled 67.4 million. The share of electric locomotives was 45 per cent and that of electric railcars was 35 per cent of locomotive-kilometres. In all, 16 per cent of locomotive-kilometres were driven with diesel locomotives and three per cent with diesel railcars.
The total volume of gross tonne-kilometres of train traffic was 31.5 billion gross tonne-kilometres in 2020. Freight traffic accounted for 67 per cent of the gross tonne-kilometres and passenger traffic for 33 per cent of the gross tonne-kilometres. Gross tonne-kilometres of freight traffic decreased by three per cent from the previous year but those of passenger traffic decreased by 11 per cent. In passenger traffic, the gross tonne-kilometres of long-distance trains were 7.7 billion gross tonne-kilometres and in local trains 2.6 billion gross tonne-kilometres. The gross tonne-kilometres of long-distance traffic decreased by 16 per cent. In passenger traffic, the average train weight was 303 tonnes and in freight traffic 1,508 tonnes in 2020.
In 2020, a total of 28.2 billion gross tonne-kilometres were hauled, of which 19.1 billion gross tonne-kilometres hauled came from freight traffic and 9.1 billion from passenger traffic.
In 2020, the total number of vehicle-axle-kilometres of passenger and freight trains was 2.1 billion vehicle-axle-kilometres, which was six per cent less than in 2019. Coaches accumulated 0.6 billion vehicle-axle-kilometres and freight wagons loaded in freight traffic 0.8 billion and empty wagons 0.7 billion vehicle-axle-kilometres. Of vehicle-axle-kilometres, 69 per cent were hauled by electric locomotives and 17 per cent by diesel locomotives. Electric railcars accounted for 14 per cent and diesel railcars half a per cent of all vehicle-axle-kilometres.
Energy consumption in train traffic totalled 3 petajoules in 2020, which was ten per cent less than one year before. Measured in petajoules, the share of electricity was 71 per cent and that of light fuel oil 29 per cent of energy consumption.
Rail traffic accidents
There were 12 accidents classified as significant on railways in 2020. The number of significant accidents decreased by two compared with 2019. In the accidents, four persons were killed and seriously injured. The number of persons killed was one more, but one fewer was seriously injured than in 2019. Most of the accidents leading to death and serious injuries were caused by accidents involving level crossings. Two persons died in level crossing accidents and three persons were seriously injured in them in 2020. Other significant accidents were passenger accidents caused by rolling stock in motion, of which three occurred and other accidents, which numbered two.
The number of significant rail traffic accidents was 0.25 per million train-kilometres. In 2019, the corresponding ratio was 0.27. In 2020, there were 0.17 fatalities and serious injuries per million train-kilometres.
Rail network
The length of the Finnish rail network was 5,918 kilometres at the end of 2020. Of the rail network, 5,226 kilometres were single-track railways and 692 kilometres two-track or multi-track railways. A total of 3,349 kilometres of the rail network have been electrified. One-half of single-track track railways are electrified and double-track or multiple-track track railways are fully electrified.
At the end of 2020, the length of the Finnish rail network was 8,598 track-kilometres, of which 6,707 were main tracks and 1,891 were sidings. The length of the rail network had gone up by 47 track-kilometres from the previous year, or by 0.5 per cent. Over one-half of main tracks are classified as belonging to line category D. Category A contained 524 track-kilometres, or eight per cent of main tracks. In all, 5,127 kilometres or 76 per cent of main tracks were tracks with concrete sleepers. Continuous-welded tracks amounted to 5,233 kilometres in 2020.
At the end of 2020, the Finnish railway network had 2,594 level crossings, which is 103 fewer than in the year before. Of the level crossings, 1,882 were without safety equipment and 712 had safety equipment. There were 2,209 level-separated crossings, of which 901 had overpasses and 1,308 underpasses.
Investments in track construction and maintenance amounted to EUR 316 million in 2020, which is 32 per cent more than one year earlier.
Source: Railway Statistics, Statistics Finland
Inquiries: Ville Keränen 029 551 3609, Sami Lahtinen 029 551 3207, Matti Kokkonen 029 551 3770, liikenne.matkailu@stat.fi
Head of Department in charge: Hannele Orjala
Publication in pdf-format (175.7 kB)
- Tables
-
Tables in databases
Pick the data you need into tables, view the data as graphs, or download the data for your use.
Updated 27.8.2021
Official Statistics of Finland (OSF):
Railway Statistics [e-publication].
ISSN=2670-3351. 2020. Helsinki: Statistics Finland [referred: 16.7.2026].
Access method: http://stat.fi/til/rtie/2020/rtie_2020_2021-08-27_tie_001_en.html