Published: 24 April 2017
Producer prices for manufactured products grew by 4.8 per cent from March last year
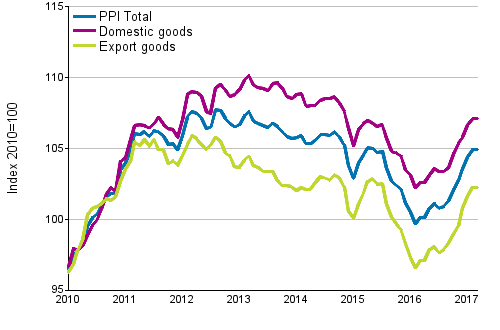
According to Statistics Finland, producer prices for manufactured products rose by an average of 4.8 per cent from March 2016 to March 2017. Producer prices for manufactured products sold on the domestic market rose by 4.4 per cent, while the producer prices of export products went up by 5.3 per cent.
Producer Price Index (PPI) 2010=100, 1/2010–3/2017

The rise in the producer prices for manufactured products was particularly caused by increased prices of manufacturing of basic metals and oil products from March 2016. The rising of the prices was curbed particularly by falls in the prices of paper and paper board products, and electronic appliances.
The Export Price Index rose by 5.3 per cent and the Import Price Index by 12.8 per cent in the year. The Basic Price Index for Domestic Supply went up by 6.5 per cent. The Basic Price Index for Domestic Supply including taxes went up by 6.0 per cent.
Export prices were, in particular, boosted by higher prices of manufacturing of basic metals and oil products from March 2016. The rise in prices was curbed especially by lower prices of paper and paper board products. The rise in import prices was, in turn, especially caused by higher prices of oil products and metal ores compared with last year's March. The rise in prices was curbed especially by lower prices of paper and paper board products.
From February to March, producer prices for manufactured products remained unchanged on average.
Producer Price Indices 2010=100, March 2017
| Index | Monthly change, % | Annual change, % | |
| Producer Price Index, total | 104.9 | 0.0 | 4.8 |
| - Producer Price Index, domestic goods | 107.1 | 0.0 | 4.4 |
| - Producer Price Index, export goods | 102.3 | 0.0 | 5.3 |
| Export Price Index | 102.3 | 0.0 | 5.3 |
| Import Price Index | 106.3 | 0.5 | 12.8 |
| Basic Price Index for Domestic Supply | 108.5 | 0.3 | 6.5 |
| Basic Price Index for Domestic Supply, incl. taxes | 111.8 | 0.3 | 6.0 |
Producer Price Indices 1949=100, March 2017
| Index | Monthly change, % | Annual change, % | |
| Production Price Index | 1934 | 0.0 | 4.8 |
| Export Price Index | 1670 | 0.0 | 5.3 |
| Import Price Index | 1587 | 0.5 | 12.8 |
| Wholesale Price Index | 2249 | 0.3 | 6.0 |
Source: Producer Price Index 2017, March. Statistics Finland
Inquiries: Anni Huuskonen 029 551 2992, Antti Kytönen 029 551 3475, Anna-Riikka Pitkänen 029 551 3466, thi.tilastokeskus@stat.fi
Director in charge: Ville Vertanen
Publication in pdf-format (375.7 kB)
- Tables
-
Tables in databases
Pick the data you need into tables, view the data as graphs, or download the data for your use.
Appendix tables
- Appendix table 1. Producer Price Indices 2010=100, index numbers and year-on-year changes, March 2017 (24.4.2017)
- Appendix table 2. Producer Price Indices 1949=100, March 2017 (24.4.2017)
- Appendix table 3. Producer Price Index 2010=100 (NACE-TOL 2008), March 2017 (24.4.2017)
- Appendix table 4. Producer Price Index 2010=100 (MIG), March 2017 (24.4.2017)
- Appendix table 5. Export Price Index 2010=100 (NACE-TOL 2008), March 2017 (24.4.2017)
- Appendix table 6. Export Price Index 2010=100 (MIG), March 2017 (24.4.2017)
- Appendix table 7. Import Price Index 2010=100 (NACE-TOL 2008), March 2017 (24.4.2017)
- Appendix table 8. Import Price Index 2010=100 (MIG), March 2017 (24.4.2017)
- Appendix table 9. Basic Price Index for Domestic Supply 2010=100 (NACE-TOL 2008), March 2017 (24.4.2017)
- Appendix table 10. Basic Price Index for Domestic Supply 2010=100 (MIG), March 2017 (24.4.2017)
- Appendix table 11. Basic Price Index for Domestic Supply 2010=100 (NACE-TOL 2008), including taxes, March 2017 (24.4.2017)
- Appendix table 12. Basic Price Index for Domestic Supply 2010=100 (MIG), including taxes, March 2017 (24.4.2017)
- Appendix table 13. Production Price Index 1949=100 (SITC), March 2017 (24.4.2017)
- Appendix table 14. Production Price Index 1949=100 (ISIC), March 2017 (24.4.2017)
- Appendix table 15. Export Price Index 1949=100, March 2017 (24.4.2017)
- Appendix table 16. Import Price Index 1949=100, March 2017 (24.4.2017)
- Appendix table 17. Wholesale Price Index 1949=100, March 2017 (24.4.2017)
- Appendix table 18. Producer Price Index 2005=100, March 2017 (24.4.2017)
- Appendix table 19. Export Price Index 2005=100, March 2017 (24.4.2017)
- Appendix table 20. Import Price Index 2005=100, March 2017 (24.4.2017)
- Appendix table 21. Basic Price Index for Domestic Supply 2005=100, March 2017 (24.4.2017)
- Appendix table 22. Wholesale Price Index 2005=100, March 2017 (24.4.2017)
- Appendix table 23. Producer Price Indices for Services 2010=100, 1st quarter 2017 (24.4.2017)
- Appendix table 24. Producer Price Index, international comparison (24.4.2017)
- Appendix table 25. Wood pellet, consumer price (24.4.2017)
- Appendix table 26. Basic Price Index for Domestic Supply 2000=100 (NACE-TOL 2002), March 2017 (24.4.2017)
- Quality descriptions
Updated 24.4.2017
Official Statistics of Finland (OSF):
Producer price indices [e-publication].
ISSN=1799-3695. March 2017. Helsinki: Statistics Finland [referred: 11.2.2026].
Access method: http://stat.fi/til/thi/2017/03/thi_2017_03_2017-04-24_tie_001_en.html

