2. Professional differentiation among wage and salary earners and entrepreneurs in 2018 and 2013
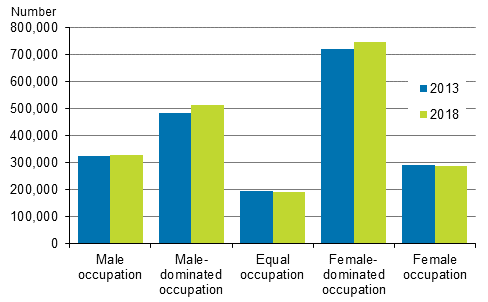
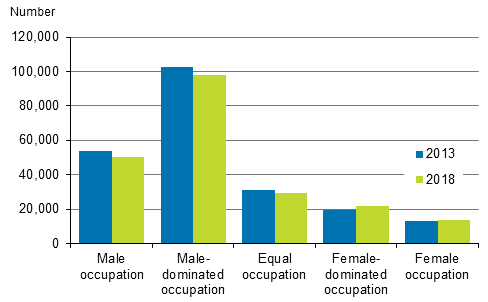
The shares of entrepreneurs and wage and salary earners working in equal occupations did not change much in five years. The shares of wage and salary earners or entrepreneurs with occupational data working in equal occupational groups were for both around half a percentage point lower in 2018 than in 2013.
Figure 1. Number of wage and salary earners in various segregation classes in 2013 and 2018

Professional differentiation by sex, segregation, is based on the classification of occupational groups by gender proportions. The strength of the segregation is determined based on how many persons work in equal occupational groups.
Table 1. 5-class segregation classification of occupations
| Segregation class | The occupational groups in which |
| Female occupation | women > 90 % |
| Female-dominated occupation | 60 % < share of women <= 90 % |
| Equal occupation | 40 % <= share of women / men <=60 % |
| Male-dominated occupation | 60 % < share of men <= 90 % |
| Male occupation | men > 90 % |
Occupational segregation among wage and salary earners and entrepreneurs is examined in the following sections based on the 5-digit level of the Classification of Occupations 2010.
2.1 Number of wage and salary earners working in equal occupations fell by 4,000 in five yearsIn all, 9.2 per cent of all wage and salary earners were in 2018 in so-called equal occupational groups, where the share of different sexes among those included in the occupational group is 40 to 60 per cent. The share of wage and salary earners working in equal occupations among all wage and salary earners was 0.45 percentage points lower in 2018 than in 2013.
For wage and salary earners, the following occupational groups had been removed from equal occupations in the past five years: other transport clerks (6,640), insurance representatives (3,990), and musicians, singers and composers (4,490). In all, 4,070 fewer worked in equal occupational groups of wage and salary earners in 2018.
Altogether 23,100 wage and salary earners worked in occupations that had become even by their gender distribution during this period. The biggest occupational groups turned into equal occupational groups over the past five years were mail carriers (9,400 persons), building construction architects (3,310 persons) and sports coaches, instructors and officials (2,450 persons).
For wage and salary earners, the most evenly divided occupational groups in 2018 were chemical and physical science technicians (240 persons in total of whom 49.6 per cent women and 50.4 per cent men), advertising and public relations managers (1,050 persons of whom 49.5 per cent women and 50.5 per cent men), and head teachers (universities of applied sciences) (700 persons of whom 50.1 per cent women and 49.9 per cent men).
In 2018, wage and salary earners' most common equal occupational groups were advertising and marketing professionals (15,300 persons), food and related products machine operators (15,300 persons) and vocational education teachers (12,700 persons).
Table 2. Wage and salary earners aged 18 to 74 in segregation classes in 2018 1)
| Segregation class | Wage and salary earners | Share of wage and salary earners, % | Women | Share of women, % | Men | Share of men, % |
| Female occupations | 289,275 | 14.0 | 270,821 | 25.3 | 18,454 | 1.8 |
| Female-dominated occupations | 747,820 | 36.1 | 565,663 | 52.8 | 182,157 | 18.2 |
| Equal occupations | 190,989 | 9.2 | 97,486 | 9.1 | 93,503 | 9.3 |
| Male-dominated occupations | 514,485 | 24.8 | 120,394 | 11.2 | 394,091 | 39.4 |
| Male occupations | 328,739 | 15.9 | 16,558 | 1.5 | 312,181 | 31.2 |
| Total | 2,071,308 | 100.0 | 1,070,922 | 100.0 | 1,000,386 | 100.0 |
2.2 Number of entrepreneurs working in equal occupations fell by 2,000 in five years
In 2018, a total of 13.7 per cent of all entrepreneurs were in equal occupations, where the share of different sexes among those included in the occupational groups is 40 to 60 per cent. The share of entrepreneurs working in equal occupations among all entrepreneurs was 0.43 percentage points lower in 2018 than in 2013.
The examination disregards the fact that women's share of all entrepreneurs was only 34 per cent.
Figure 2. Number of entrepreneurs in various segregation classes in 2013 and 2018

For entrepreneurs, occupational groups that have become equal occupations in five years were such as contact centre salespersons (1,100), other teaching professionals (980) and stall and market salespersons (460). Among the removed equal occupational groups, the largest were massage therapists and practical rehabilitation nurses (2,710 persons), estate agents (1,220), and bakers, pastry-cooks and confectionery makers (370). In all, 1,940 fewer persons worked in equal occupational groups of entrepreneurs in 2018.
For entrepreneurs, the most evenly divided occupational groups were laundry machine operators (around 160 persons in total of whom 49.7 per cent women and 50.3 per cent men), journalists (90 persons in total of whom 49.4 per cent women and 50.6 per cent men), domestic housekeepers (490 persons in total of whom 49.1 per cent women and 50.9 per cent men), and other therapists (200 persons in total of whom 51.0 per cent women and 49.0 per cent men).
In 2018, the most common equal occupational groups of entrepreneurs were shop keepers (small entrepreneurs) (8,590 persons), restaurant services supervisors and shift managers (4,390 persons) and fitness and recreation instructors and programme leaders (2,550 persons).
Table 3. Entrepreneurs aged 18 to 74 in segregation classes in 2018 1)
| Segregation class | Entrepreneurs | Share of entrepreneurs, % | Women | Share of women, % | Men | Share of men, % |
| Female occupations | 13,383 | 6.3 | 12,562 | 18.2 | 821 | 0.6 |
| Female-dominated occupations | 21,870 | 10.3 | 15,308 | 22.2 | 6,562 | 4.6 |
| Equal occupations | 29,027 | 13.7 | 13,723 | 19.9 | 15,304 | 10.7 |
| Male-dominated occupations | 98,028 | 46.1 | 24,493 | 35.5 | 73,535 | 51.2 |
| Male occupations | 50,311 | 23.7 | 2,933 | 4.2 | 47,378 | 33.0 |
| Total | 212,619 | 100.0 | 69,019 | 100.0 | 143,600 | 100.0 |
Source: Employment Statistics, Statistics Finland
Inquiries: Juho Keva 029 551 3061, Elina Mikkelš 029 551 2973, info@stat.fi
Head of Department in charge: Hannele Orjala
Updated 16.10.2020
Official Statistics of Finland (OSF):
Employment [e-publication].
ISSN=2323-6825. Industry, employer sector and jobs 2018,
2. Professional differentiation among wage and salary earners and entrepreneurs in 2018 and 2013
. Helsinki: Statistics Finland [referred: 5.2.2026].
Access method: http://stat.fi/til/tyokay/2018/04/tyokay_2018_04_2020-11-09_kat_002_en.html

