2 Employment and unemployment in 2015
2.1 Employment weakened in 2015
Number of employed persons decreased from the previous year
According to Statistics Finland's Labour Force Survey, the employment rate for the population aged 15 to 64 was 68.1 per cent in 2015. The employment rate was 0.2 percentage points lower than in 2014. Men’s employment rate was 68.5 per cent and women’s 67.7 per cent. The employment rate of both men and women decreased by 0.2 percentage points from 2014. (Figure 1.)
Population changes have an effect on the employment rate as well. The population aged 15 to 64 has decreased in the past few years as large age groups born after the wars have moved to the age group of those aged 65 to 74.
Figure 1. Employment rates by sex in 1991 to 2015, persons aged 15 to 64, %
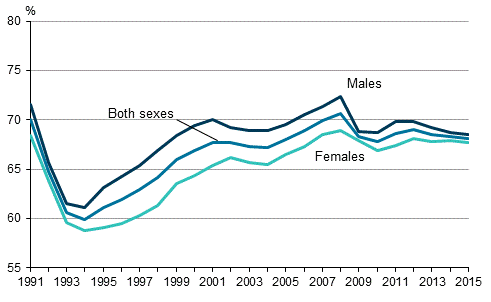
The employment rate of women aged between 15 and 64 has been considerably higher in the longer term in Finland than the corresponding average for the EU28. Men's employment rate has been quite close to the average for the EU28. In 2014, the average employment rate of women for the EU28 was 59.5 per cent and 70.1 per cent for men.
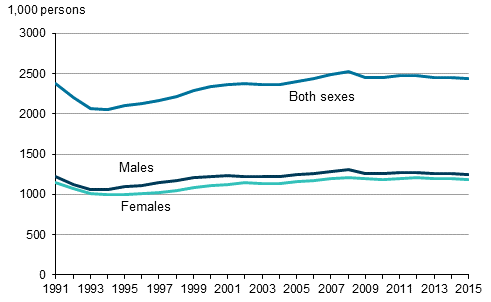
In 2015, the number of employed persons among those aged 15 to 74 was 2,437,000, which was 10,000 lower than in 2014 (Figure 2). The number of employed persons decreased in all quarters of 2015 compared to the corresponding quarters of the previous year.
Figure 2. Number of employed persons by sex in 1991 to 2015, persons aged 15 to 74
Both men’s and women’s employment weakened
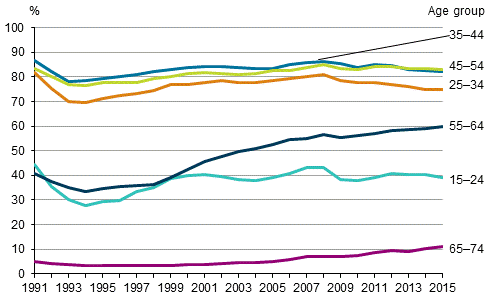
The employment situation of both men and women weakened from 2014 to 2015. In both groups the number of employed persons decreased by 5,000 compared with 2014. Figure 3 shows a time series on the changes in the number of employed persons by sex. The employment improved in the groups of persons aged 55 to 64 and 65 to 74 from 2014 to 2015. In other age groups, employment weakened most in the 15 to 24 age group from the year before (Figure 4).Figure 3. Change from the previous year in the number of employed persons by sex in 2001 to 2015, persons aged 15 to 74
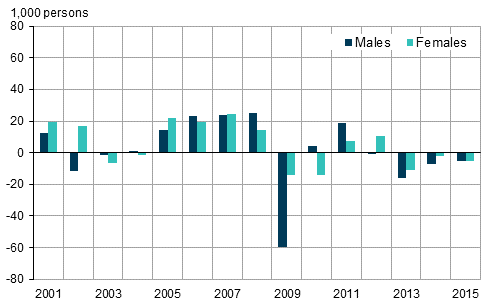
Figure 4. Employment rates by age group in 1991 to 2015, %
Number of employed persons decreased most in wholesale trade and increased in human health activities
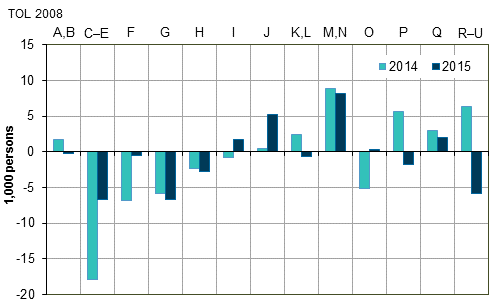
In 2015, the number of employed persons decreased in manufacturing (C-E) by 7,000 persons. The number of employed persons decreased by as much in wholesale and retail trade (G), where the drop applied exclusively to persons employed in wholesale trade. The number of employed persons increased by 8,000 persons in business services (M, N) and by 5,000 persons in information and communication activities (J). Employment in human health and social work activities (Q) also grew slightly. The number of employed persons increased in the human health activities industry group by 11,000 persons but in social work activities the number of employed persons decreased. ( PX_Web Statfin table 030 )
Figure 5 shows the change from the previous year in the number of employed persons by industry in 2014 and 2015.
Figure 5. Change from the previous year in the number of employed persons by industry in 2014 to 2015, persons aged 15 to 74
Industries (Standard Industrial Classification TOL 2008)
| A, B | 01–09 | Agriculture, forestry and fishing; mining and quarrying |
| C-E | 10–39 | Manufacturing; electricity, gas, steam and air conditioning and water supply; sewerage and waste management |
| F | 41–43 | Construction |
| G | 45–47 | Wholesale and retail trade; repair of motor vehicles and motorcycles |
| H | 49–53 | Transportation and storage |
| I | 55–56 | Accommodation and food service activities |
| J | 58–63 | Information and communication |
| K, L | 64–68 | Financial, insurance and real estate activities |
| M, N | 69–82 | Professional, scientific and technical activities; administrative and support service activities |
| O | 84 | Public administration and defence; compulsory social security |
| P | 85 | Education |
| Q | 86–88 | Human health and social work activities |
| R–U | 90–99 | Arts, entertainment and recreation; other service activities |
The weakening of employment was quite evenly directed at both the private and public sectors. Five thousand fewer persons worked both in the private and public sectors than in 2014.
There were 2,090,000 employees in 2015, which was 14,000 fewer than in the previous year. In turn, the number of self-employed persons grew slightly from 2014. In 2015, the total number of self-employed persons and unpaid family workers was 346,000. Of this, the share of unpaid family workers was 11,000. The share of self-employed persons and unpaid family workers among the employed was 14 per cent in 2015.
Examined by socio-economic group, employment improved by 11,000 persons for upper-level employees. Employment weakened among lower-level employees by 19,000 persons and by 5,000 persons among manual workers. The number of upper-level employees grew by 11,000 persons among women, the number of lower-level employees in turn declined by 21,000 persons. The number of women in manual worker occupations grew by 4,000 from 2014. The number of men remained almost unchanged both among upper-level and lower-level employees from 2014 to 2015. The number of men in manual worker occupations in turn decreased by 9,000 persons.
Number of hours worked decreased
In 2015, a total of 3.9 billion hours were worked in the whole national economy. The number of hours worked by employed persons was almost the same as in 2014. In 2015, the average annual number of hours worked by an employed person was 1,620, whereas in 2014 the respective figure was 1,617 hours.
In 2015, the number of underemployed persons was 137,000, which was 10,000 more than in 2014. Underemployed persons refer to persons working involuntarily part-time or a shortened working week or that have not had work due to a low number of orders or customers or due to being temporarily laid off.
2.2 Number of unemployed increased in 2015
Unemployment continued growing in 2015. In 2015, the average number of unemployed was 252,000, which was 20,000 more than in the year before. The number of unemployed men was 137,000 and that of women 115,000. The number of unemployed men grew by 8,000 persons, and that of unemployed women by 12,000 persons.
The unemployment rate was, on average, 9.4 per cent in 2015, having been 8.7 per cent in 2014. Men’s unemployment rate was 9.9 per cent and women’s 8.8 per cent.
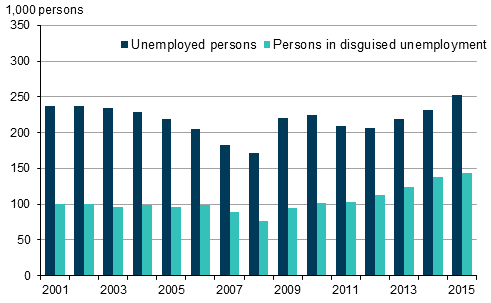
Besides unemployed persons, there were 144,000 persons aged 15 to 74 classified as being in disguised unemployment, who would and could have accepted work, but had not looked for it actively. The number of persons in disguised unemployment grew by 5,000 compared with 2014. The combined total number of unemployed persons and persons in disguised unemployment was 396,000 in 2015 (Figure 6). More about persons in disguised unemployment in Section 4 Inactive population.
Figure 6. Unemployed persons and persons in disguised unemployment in 2001 to 2015, persons aged 15 to 74
In 2015, the unemployment rate for young people aged 15 to 24, that is, the proportion of the unemployed among the labour force, stood at 22.4 per cent, which was 1.9 percentage points higher than one year previously. In other age groups, rates of unemployment grew less (Figure 7). In the 15 to 24 age group, 73,000 persons were unemployed, which was 29 per cent of all unemployed persons.
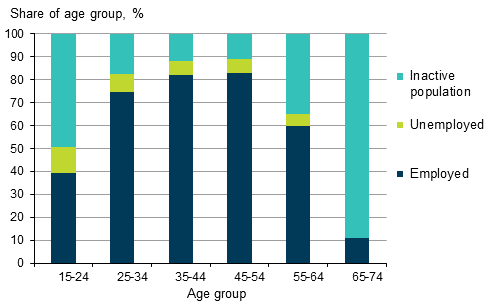
The share of unemployed people aged 15 to 24 among the population in the same age group was 11.3 per cent in 2015 (Figure 8). The share rose by one percentage point from 2014.
Figure 7. Rates of unemployment by age in 1991 to 2015, %
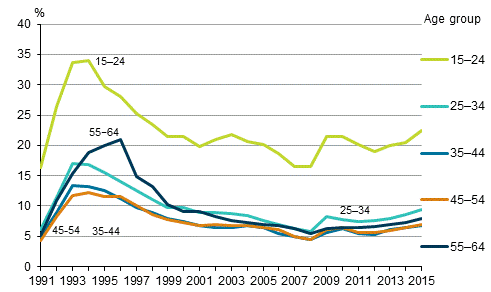
Figure 8. Shares of employed and unemployed persons, and inactive population of age group in 2015, %
2.3 The labour force increased further
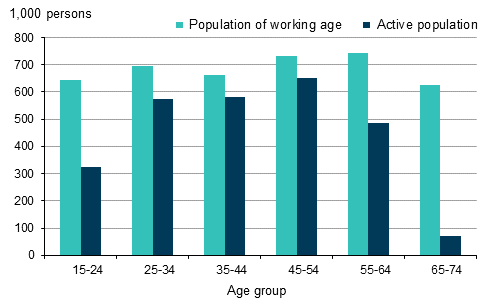
In 2015, the Finnish population included 4,102,000 persons aged 15 to 74. The number of working-age people (aged 15 to 74) grew by 7,000 persons from 2014. Simultaneously, the number of persons aged 15 to 64 decreased, however, as the growth was mostly directed at the age group of those aged 65 to 74, which grew by 22,000 persons from the year before. The age group of those aged 55 to 64 diminished by 8,000 persons but still remained the largest age group among people of working age (Figure 9).
The share of the active population, i.e. employed and unemployed persons aged 15 to 74, increased from 65.4 per cent in 2014 to 65.6 per cent in 2015. The size of the active population grew by 10,000 persons.
In 2015, the number of persons in the inactive population aged 15 to 74 was 1,413,000, which was slightly fewer than in 2014. More about the inactive population in Section 4.
Figure 9. Population of working age and active population by age group in 2015
2.4 Number of employees’ new contracts of under one year’s duration decreased in 2015
Temporary employment is more widespread among women than men
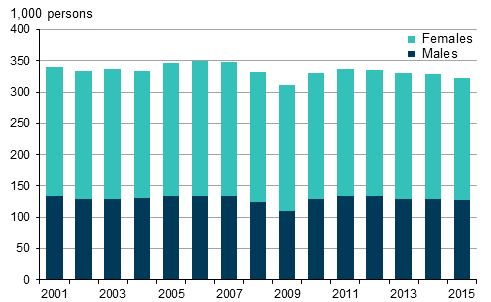
In 2015, the average number of employees in Finland was 2,090,000, which was 14,000 lower than in 2014. In all, 322,000 employees had temporary employment contracts, of whom 194,000 were women and 128,000 men (Figure 10).
Figure 10. Number of temporary employees aged 15 to 74 by sex in 2001 to 2015
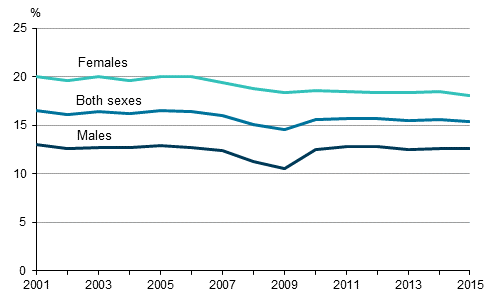
Eighty-five per cent of all employment contracts of employees were permanent and 15 per cent temporary in 2015. The shares remained almost unchanged from the year before. Temporary employment relationships are more common for women than for men. In 2015, eighteen per cent of female employees and around 13 per cent of male employees worked in a temporary employment relationship. In recent years the number of temporary female employees has remained almost unchanged. For men, the share of temporary employees was in 2015 still higher than in 2008 and 2009. (Figure 11.)
Figure 11. Share of temporary employees of all employees aged 15 to 74 by sex in 2001 to 2015, %
Two out of three temporary employees would want a permanent job
Temporary employment relationships may be suitable for the life situation of the employee, a desired option or be caused by that there is no permanent job available. Approximately 24 per cent of temporary employees did not want a permanent job in 2015. Around one-half of them were aged between 15 and 24. Summer workers are a typical group of persons working voluntarily in temporary jobs.
Around 40 per cent of young people aged 15 to 24 in temporary employment did not want permanent work. Correspondingly, in the age group 65 to 74, around 80 per cent did not want permanent work.
However, a more common reason for working in a temporary employment relationship is that permanent work cannot be found. In 2015, lack of permanent work was the reason why around 68 per cent of temporary employees worked in temporary jobs. The share of persons working involuntarily in temporary jobs among all temporary employees remained almost unchanged compared to 2014.
In 2015, there were 220,000 temporary employees on the labour market who had not found a permanent job even though they would have wanted one. Of them, 136,000 were women and 83,000 men. Involuntary working under temporary contracts increases with age.
Around one-half of new employment contracts were temporary
In 2015, there were 396,000 employees whose employment relationship had lasted less than a year, which was 10,000 fewer than in 2014. (Figure 12.)
Figure 12. Employees with employment contracts of under one year's duration in 2001 to 2015, persons aged 15 to 74
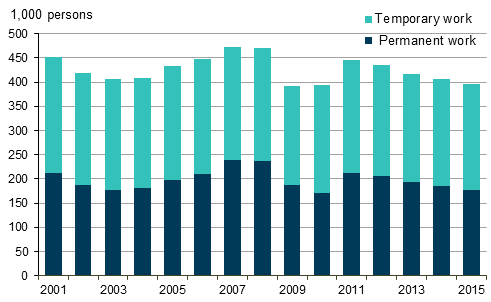
Fifty-five per cent of the employment contracts of under one year's duration were temporary. There has been a clear difference between women and men in whether a new employment relationship is temporary or permanent. In 2015, 62 per cent of women’s and 48 per cent of men’s new employment relationships were temporary, which was nearly the same as in 2014.
Good one per cent of employees did temporary agency work
Temporary agency work refers to an employment relationship in which an employee works via an enterprise which provides or hires out labour force. Data on temporary agency work have been collected in the Labour Force Survey since 2008. Data on temporary agency work describe the situation in an "average" week of the survey year. In 2015, the average number of persons doing temporary agency work was 31,000, or slightly more than in 2014. The shares of men and women doing temporary agency work were almost equal.
Among all employees, the share of temporary agency workers was only good one per cent in 2015. Thus, doing temporary agency work is quite a marginal form of working on the Finnish labour market.
Temporary agency workers are employed by several industries. Their use is most common in wholesale and retail trade (G), in accommodation and food service activities (I), and in manufacturing (C-E). Each of these industries employed a couple of thousand temporary agency workers.
2.5 Number of persons working part-time remained almost unchanged
Number of part-time employees highest in female-dominate industries
In 2015, altogether 378,000 persons or 15 per cent of all employed persons worked part-time. Of them, 306,000 were employees. The Labour Force Survey data on part-time employment is based on the respondents’ own reporting. The following only concerns part-time employees.
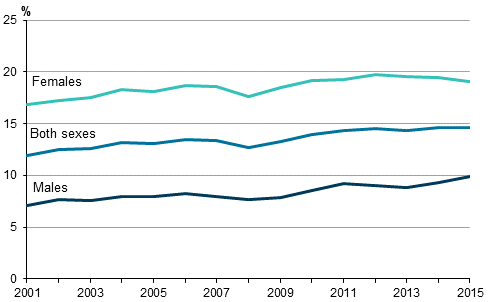
In 2015, the number of employees in part-time employment remained on level with the previous year. Part-time employment is more widespread among women than men. In 2015, nineteen per cent of female employees and ten per cent of male employees worked part-time. The number of male employees working part-time grew by nearly 6,000 persons and that of female employees working part-time decreased by almost the same amount compared with the previous year. (Figures 13 and 14)
Working part-time is widespread especially among employees between the ages of 15 and 24 of whom 42 per cent worked part-time in 2015 primarily due to studies. Correspondingly, 60 per cent of employees aged 65 to 74 worked part-time.
Nearly three-quarters of the part-time employees worked in the private sector. The numbers of part-time employees were the highest in the industries of wholesale and retail trade (G), and human health and social work activities (Q). The share of part-time employees of all employees in the industry was the largest, or 30 per cent, in retail trade (excl. motor vehicle trade).
Figure 13. Part-time employees aged 15 to 74 by sex in 2001 to 2015
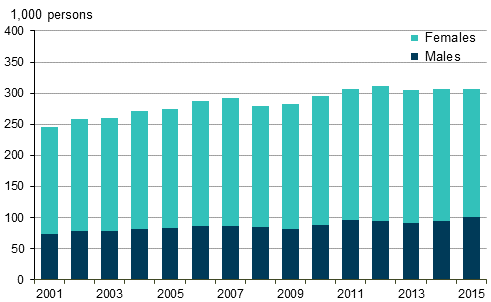
Figure 14. Share of part-time employees among employees aged 15 to 74 by sex in 2001 to 2015, %
Lack of full-time work the most common reason for part-time employment
Working part-time suits the life situation of many of those who are employed part-time. By contrast, part-time employment can be viewed as one form of underemployment in cases where the employee has not succeeded in finding full-time work even if he/she had wanted one.
In 2015, lack of full-time employment was the commonest reason for working part-time. Every third person working part-time reported this as their reason. In previous years, the most common reason for working part-time has been studying. In 2015, employees working part-time involuntarily numbered 99,000, of whom 68,000 were women and 31,000 men.
Other reported reasons related to life situation were caring for children or relatives, and health reasons. Nearly all of those who reported caring for children or relatives as the reason for working part-time were women. For nearly three in ten part-time employees the reason for working part-time was studying.
Among 55 to 64-year old employees, the number of part-time workers was 50,000, which is 14 per cent of all employees in this age group.
Source: Labour Force Survey 2015. Statistics Finland
Inquiries: Joanna Viinikka 029 551 3796, Arto Miettinen 029 551 2963, tyovoimatutkimus@stat.fi
Director in charge: Jari Tarkoma
Updated 12.4.2016
Official Statistics of Finland (OSF):
Labour force survey [e-publication].
ISSN=1798-7857. Employment and unemployment 2015,
2 Employment and unemployment in 2015
. Helsinki: Statistics Finland [referred: 17.2.2026].
Access method: http://stat.fi/til/tyti/2015/13/tyti_2015_13_2016-04-12_kat_002_en.html

