Published: 7 May 2020
Employment continued to grow in 2019
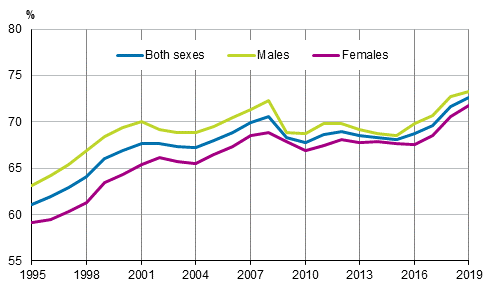
According to Statistics Finland's Labour Force Survey, the employment rate for the population aged 15 to 64 was 72.6 per cent in 2019. Men’s employment rate was 73.3 per cent and women’s 71.8 per cent. Men's employment rate grew by 0.6 percentage points and women's by 1.2 percentage points compared to 2018. These data derive from Statistics Finland’s annual review Labour Force Survey 2019, time series data 2010 to 2019.
Employment rates by sex in 1995–2019, persons aged 15 to 64, %

Growth in employment continued more subdued than in the previous year. In 2019, the average number of employed persons aged 15 to 74 in Finland was 2,566,000, which was 26,000 more than in 2018. The number of employed persons increased for the fourth year in succession. There were 10,000 more employed men and 16,000 more employed women than in 2018. The number of employees grew by 16,000 and that of self-employed persons by 11,000. The employment rate grew in all age groups.
In 2019, the number of employees in full-time work was nearly the same as in 2018 and that of employees working part-time was 12,000 higher. The share of employees working part-time was biggest in retail trade (excl. sale of motor vehicles). Forty-four per cent of all employees in the industry worked part-time.
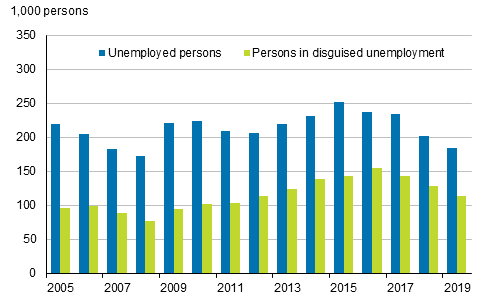
In 2019, the average number of unemployed persons was 184,000, which was 18,000 fewer than in the previous year. The unemployment rate among persons aged 15 to 74 was, on the average, 6.7 per cent in 2019, having been 7.4 per cent in 2018. The unemployment rate of men fell to 7.2 per cent and that of women to 6.2 per cent.
The number of persons in disguised unemployment decreased by 14,000 from 2018. In 2019, there were 114,000 working-age persons aged 15 to 74 classified as being in disguised unemployment, who would and could have accepted work, but had not looked for it actively.
Unemployed persons and persons in disguised unemployment in 2005 to 2019, persons aged 15 to 74

In 2019, there were 1,378,000 persons in the inactive population, i.e. 33 per cent of the population aged 15 to 74. The number was 4,000 lower than in 2018. The number of persons in the inactive population decreased most in the 55 to 64 age group, by 9,000 persons.
Links
Labour Force Survey tables in databases
Latest monthly release of the Labour Force Survey .
Source: Labour Force Survey 2019. Statistics Finland
Inquiries: Ulla Hannula 029 551 2924, Tatu Leskinen 029 551 3285, tyovoimatutkimus@stat.fi
Director in charge: Jari Tarkoma
Publication in pdf-format (1.1 MB)
- Reviews
-
- 1 Introduction (7.5.2020)
- 2 Employment and unemployment in 2019 (7.5.2020)
- 3 Working hours in 2019 (7.5.2020)
- 4 Inactive population (7.5.2020)
- 5 Labour Force Survey data content from January 2008 onwards (7.5.2020)
- 6 Concepts and definitions used in the Finnish Labour Force Survey (7.5.2020)
- 7 Classifications (7.5.2020)
- 8 Notes to the appendix tables (7.5.2020)
- Tables
-
Tables in databases
Pick the data you need into tables, view the data as graphs, or download the data for your use.
Appendix tables
- Appendix table 1. Population aged 15-74 by labour force status and sex in 2010 - 2019 (7.5.2020)
- Appendix table 2. Active population by age and sex in 2010 - 2019 (7.5.2020)
- Appendix table 3. Activity rates by age and sex in 2010 - 2019 (7.5.2020)
- Appendix table 4. Inactive population by age and sex in 2010 - 2019 (7.5.2020)
- Appendix table 5. Employed persons by age and sex in 2010 - 2019 (7.5.2020)
- Appendix table 6. Employment rates by age and sex in 2010 - 2019 (7.5.2020)
- Appendix table 7. Employed persons aged 15-64 and employment rates by Regional State Administrative Agencies (AVI) in 2015 - 2019 (7.5.2020)
- Appendix table 8. Employed persons aged 15-74 by socio-economic group and sex in 2010 - 2019 (7.5.2020)
- Appendix table 9. Employed persons aged 15-74 by educational level and sex in 2010 - 2019 (7.5.2020)
- Appendix table 10. Employed persons aged 15-74 by industry (TOL 2008) and sex in 2015 - 2019 (7.5.2020)
- Appendix table 11. Employees and self-employed persons aged 15-74 by industry (TOL 2008) in 2015 - 2019 (7.5.2020)
- Appendix table 12. Employed persons aged 15-74 by employer sector and industry (TOL 2008) in 2015 - 2019 (7.5.2020)
- Appendix table 13. Employees aged 15-74 by employer sector and sex in 2010 - 2019 (7.5.2020)
- Appendix table 14. Part-time employed persons by age and sex in 2010 - 2019 (7.5.2020)
- Appendix table 15. Part-time employed persons aged 15-74 by industry (TOL 2008) in 2015 - 2019 (7.5.2020)
- Appendix table 16. Employees aged 15-74 by type of employment relationship and sex in 2010 - 2019 (7.5.2020)
- Appendix table 17. Employees aged 15-74 by type of employment relationship and sex in 2010 - 2019, % (7.5.2020)
- Appendix table 18. Hours actually worked, including hours worked at secondary jobs, of employed persons aged 15-74 by industry (TOL 2008) in 2015 - 2019 (7.5.2020)
- Appendix table 19. Hours actually worked, including hours worked at secondary jobs, of employees aged 15-74 by industry (TOL 2008) in 2015 - 2019 (7.5.2020)
- Appendix table 20. Annual hours actually worked per employed by employer sector and industry (TOL 2008) in 2015 - 2019 (7.5.2020)
- Appendix table 21. Annual hours actually worked per employee by employer sector and industry (TOL 2008) in 2015 - 2019 (7.5.2020)
- Appendix table 22. Unemployed persons by age and sex in 2010 - 2019 (7.5.2020)
- Appendix table 23. Unemployment rates by age and sex in 2010 - 2019 (7.5.2020)
- Appendix table 24. Unemployed persons aged 15-74 and unemployment rates by Regional State Administrative Agencies (AVI) in 2015 - 2019 (7.5.2020)
- Appendix table 25. Unemployment rates by educational level and sex in 2010 - 2019, persons aged 15-74 (7.5.2020)
- Appendix table 26. Population aged 15-74 by labour force status, age and sex in 2019 (7.5.2020)
- Appendix table 27. Population aged 15-74 by labour force status, age and sex in 2019, % (7.5.2020)
- Appendix table 28. Population aged 15-64 by labour force status and region in 2019 (7.5.2020)
- Appendix table 29. Employed persons aged 15-74 by status in employment, age and sex in 2019 (7.5.2020)
- Appendix table 30. Employed persons aged 15-74 by industry (TOL 2008) and sex in 2019 (7.5.2020)
- Appendix table 31. Employed persons aged 15-64 by industry (TOL 2008) and age in 2019 (7.5.2020)
- Appendix table 32. Employed persons aged 15-74 by employer sector and industry (TOL 2008) in 2019 (7.5.2020)
- Appendix table 33. Employed persons aged 15-74 by industry (TOL 2008) and Regional State Administrative Agencies (AVI) in 2019 (7.5.2020)
- Appendix table 34. Employed persons aged 15-74 by occupation (Occupational Classification 2010) and sex in 2019 (7.5.2020)
- Appendix table 35. Employees aged 15-74 by socio-economic group and sex in 2019 (7.5.2020)
- Appendix table 36. Employed persons aged 15-74 having worked at secondary jobs during the survey week by industry (TOL 2008) of main job in 2019 (7.5.2020)
- Appendix table 37. Employees aged 15-74 having paid overtime during the survey week and the proportion of them of all employees by industry (TOL 2008) in 2019 (7.5.2020)
- Appendix table 38. Employees aged 15-74 in permanent and temporary (fixed-term) work by industry (TOL 2008) in 2019 (7.5.2020)
- Appendix table 39. Employees aged 15-74 in permanent and temporary (fixed-term) work by employer sector and sex in 2019 (7.5.2020)
- Appendix table 40. Employees aged 15-74 in temporary (fixed-term) work by reason for temporary work and sex in 2019, % (7.5.2020)
- Appendix table 41. Full-time and part-time employees aged 15-74 by industry (TOL 2008) in 2019 (7.5.2020)
- Appendix table 42. Full-time and part-time employees aged 15-74 by employer sector and sex in 2019 (7.5.2020)
- Appendix table 43. Employees aged 15-74 by type of employment relationship, age and sex in 2019 (7.5.2020)
- Appendix table 44. Different types of employment relationships of employees whose present work has continued less than 12 months by age and sex in 2019, persons aged 15-64, % (7.5.2020)
- Appendix table 45. Employed persons aged 15-74 by usual weekly working hours in main job and industry (TOL 2008) in 2019 (7.5.2020)
- Appendix table 46. Employees aged 15-74 by usual weekly working hours in main job and industry (TOL 2008) in 2019 (7.5.2020)
- Appendix table 47. Average usual weekly working hours in main job of employed persons aged 15-74 in full-time and part-time work by socio-economic group and sex in 2019 (7.5.2020)
- Appendix table 48. Average usual weekly working hours in main job of employees aged 15-74 by socio-economic group and employer sector in 2019 (7.5.2020)
- Quality descriptions
-
- Quality Description: Labour force survey (7.5.2020)
Updated 7.5.2020
Official Statistics of Finland (OSF):
Labour force survey [e-publication].
ISSN=1798-7857. Employment and unemployment 2019. Helsinki: Statistics Finland [referred: 20.2.2026].
Access method: http://stat.fi/til/tyti/2019/13/tyti_2019_13_2020-05-07_tie_001_en.html

