Published: 1 October 2018
Every fourth person is not a member of any religious community
According to Statistics Finland, one-quarter of the population of Finland are not members of a religious community registered in Finland. Thirty per cent of men had no religious affiliation and 23 per cent of women in 2017.
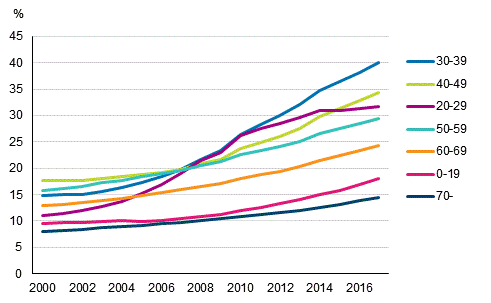
Persons not members of any religious community in 2000 to 2017, per cent of the whole age group

Share of persons with no religious affiliation highest for those in their thirties
The share of persons not members of any religious community was highest among those aged 30 to 39, being 40 per cent of the age group. One-third of Finnish-speaking persons aged 30 to 39, that is, 33 per cent, were not members of a religious community, while the figure for foreign-language speakers of the same age was 88 per cent.
The share of persons not members of a religious community was the second highest among those aged 40 to 49, at 34 per cent. The share was lowest, 14 per cent, for those aged 70 or over. The share was also smaller than in the rest of the population for children and young people: 18 per cent of those aged 0 to 19 had no religious affiliation.
Persons with no religion group already number 1.45 million
The number of persons with no religious affiliation exceeded the one million mark in 2010. At the end of 2017, the number of persons with no religious affiliation had already exceeded 1.45 million.
Twenty-two per cent of those speaking Finnish as their mother tongue and 17 per cent of those with Swedish as their mother tongue did not belong to any religious group. Of foreign-language speakers, as many as 85 per cent are not members of any religious community registered in Finland. The information on religious community does not represent accurately immigrants, in particular. Not all religious communities are included in the register of the National Board of Patents and Registration and not all those practising a religion belong to parishes.
Immigration has increased the age groups of young people
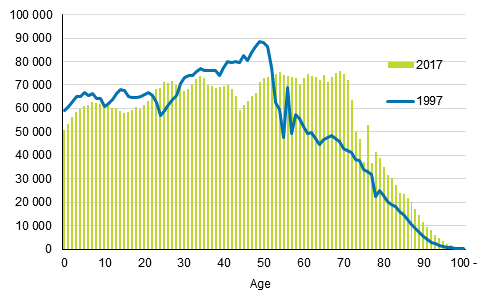
Finland's population has grown from 5.1 to 5.5 million, or by nearly 400,000 persons in the last 20 years. During this time, the population of the youngest age group aged under 10 has declined. In contrast, age groups of those in their twenties have grown slightly due to immigration. The ageing of baby boom generations is visible in that the number of persons aged 40 to 50 has decreased considerably, and that of those aged 60 to 70 has grown.
Population by age in 1997 and 2017

Persons born in 1948 were the largest age cohort in Finland’s population at the end of both 1997 and 2017. At the end of 2017, there were 816 persons alive who were born before Finland's independence.
Every fifth Finn aged 65 or over
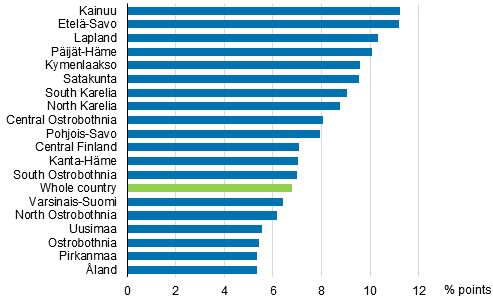
The share of people aged 65 or over in the whole population has risen from 14.6 to 21.4 per cent between 1997 and 2017, that is, by 6.8 percentage points. The share has risen least in Åland, Pirkanmaa, Ostrobothnia and Uusimaa, by under six percentage points in each.
Change in the share of persons aged 65 or over by region in 1997 to 2017, percentage points

The share of people aged 65 or over has risen most in Kainuu, Etelä-Savo, Lapland and Päijät-Häme, by over 10 percentage points in each. In Kainuu, for example, the share of people aged 65 or over in the population of the whole region rose from 15 to 27 per cent between 1997 and 2017.
Source: Population Structure 2017, Statistics Finland
Inquiries: Marja-Liisa Helminen 029 551 3273, Markus Rapo 029 551 3238, info@stat.fi
Director in charge: Jari Tarkoma
Publication in pdf-format (367.6 kB)
- Tables
-
Tables in databases
Pick the data you need into tables, view the data as graphs, or download the data for your use.
Appendix tables
- Appendix table 1. Married women by duration and order of marriage 31.12.2017 (1.10.2018)
- Appendix table 2. Females aged 15 - 82 by number of live-born children 31.12.2017 (1.10.2018)
- Appendix table 3. Males aged 15 - 82 by number of live-born children 31.12.2017 (1.10.2018)
- Appendix table 4. Women by age, number of children and the proportion of birth 31.12.2017 (1.10.2018)
- Appendix table 5. Males by age and number of children 31.12.2017 (1.10.2018)
- Figures
- Quality descriptions
-
- Quality description: Population structure 2017 (1.10.2018)
Updated 01.10.2018
Official Statistics of Finland (OSF):
Population structure [e-publication].
ISSN=1797-5395. annual review 2017. Helsinki: Statistics Finland [referred: 4.2.2026].
Access method: http://stat.fi/til/vaerak/2017/01/vaerak_2017_01_2018-10-01_tie_001_en.html

