Published: 26 April 2019
Finland’s preliminary population figure 5,518,393 at the end of March
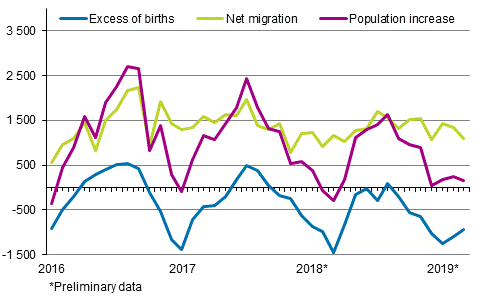
According to Statistics Finland's preliminary data, Finland's population at the end of March was 5,518,393. During January-March Finland's population increased by 474 persons, which is 95 less than in the preliminary data the year before. The reason for the population increase was migration gain from abroad: the number of immigrants was 3,853 higher than that of emigrants. The number of births was 3,290 lower than that of deaths.
Population increase by month 2016–2019*

According to the preliminary statistics for January-March 2019, a total of 10,897 children were born, which is 763 fewer than in the corresponding period 2018. The number of deaths was 14,187, which is 770 lower than one year earlier.
Altogether 7,005 persons immigrated to Finland from abroad and 3,152 persons emigrated from Finland during January-March period. The number of immigrants was 77 lower and the number of emigrants 615 lower than in the previous year. In all, 1,593 of the immigrants and 2,109 of the emigrants were Finnish citizens.
According to the preliminary data, the number of inter-municipal migrations totalled 55,168 by the end of March. Compared with the previous year, the decrease was 3,139 migrations according to the municipal division of 2019.
Same-sex marriages took legal effect in March 2017. A total of 40 women and 26 men entered into marriage in which the spouse was of the same sex during January-March period in 2019. In all, 2 women and 2 men changed their registered partnership into marriage.
According to preliminary data by region, the population grew only in Uusimaa, Pirkanmaa, North Ostrobothnia, Åland, Central Ostrobothnia and Southwest Finland in the beginning of 2019.
The population grew most in absolute numbers in Uusimaa, where it grew by 3,729 persons. The next largest increase in population was seen in Pirkanmaa, 384 persons. Relative to the population, population increase was highest in Uusimaa, 2.2 per mil, in Åland, 1.8 per mil and in Pirkanmaa, 0.7 per mil. Population loss was highest in absolute numbers in the region of South Savo that lost 504 persons of its population. The population of Satakunta decreased by 426 persons, which was the second biggest population loss. Relative to the population, the biggest population loss was found in South Savo, 3.5 per mil.
Most migration gain from intramunicipal and international migration was collected by Uusimaa, 3,408 persons and Pirkanmaa, 590 persons. Most migration gain in relative terms based on total net migration was attained by Uusimaa, 2.0 per mil and Åland, 1.3 per mil.
In absolute numbers, migration loss from total net migration was biggest in the region of South Savo, 167 persons. In the region of Satakunta the loss was 108 persons. In relative terms, the biggest migration loss from total net migration was found in the region of South Savo, 1.2 per mil of the population.
During January to March 2019, migration between regions numbered 23,776. The positive gain from migration between regions was seen in Uusimaa, Pirkanmaa and Åland. In absolute numbers, the highest gain from migration between regions was received by Uusimaa, 1,593 persons. The relative migration gain was highest in Uusimaa, 1.0 per mil of the population.
Migration loss from migration between regions was biggest in absolute numbers in the region of Satakunta, 257 persons. Migration loss from migration between regions was biggest in relative terms in the region of South Savo, 1.6 per mil of the population.
Source: Preliminary population statistics, Statistics Finland
Inquiries: Joonas Toivola 029 551 3355, Joni Rantakari 029 551 3249, Matti Saari 029 551 3401, info@stat.fi
Director in charge: Jari Tarkoma
Publication in pdf-format (246.4 kB)
- Tables
-
Tables in databases
Pick the data you need into tables, view the data as graphs, or download the data for your use.
Appendix tables
- Figures
-
- Appendix figure 1. Live births by quarter 1997 - 2017 and preliminary data 2018 - 2019 (26.4.2019)
- Appendix figure 2. Deaths by quarter 1997 - 2017 and preliminary data 2018 - 2019 (26.4.2019)
- Appendix figure 3. Intermunicipal migration by quarter 1997 - 2017 and preliminary data 2018 - 2019 (26.4.2019)
- Appendix figure 4. Immigration by quarter 1997 - 2017 and preliminary data 2018 - 2019 (26.4.2019)
- Appendix figure 5. Emigration by quarter 1997 - 2017 and preliminary data 2018 - 2019 (26.4.2019)
Updated 26.04.2019
Official Statistics of Finland (OSF):
Preliminary population statistics [e-publication].
ISSN=2243-3627. March 2019. Helsinki: Statistics Finland [referred: 22.2.2026].
Access method: http://stat.fi/til/vamuu/2019/03/vamuu_2019_03_2019-04-26_tie_001_en.html

