2. Prevalence of innovation activity in enterprises in 2010 to 2012
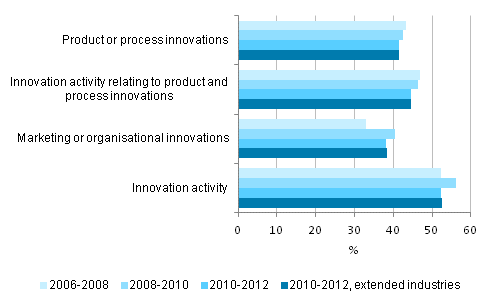
Enterprises reported innovation activity in 2010 to 2012 almost as frequently as in the years preceding the survey period. Altogether, 42 per cent of enterprises reported adoption of product or process innovations, while, in the preceding time periods 2006 to 2008 and 2008 to 2010, the corresponding shares were also good 40 per cent. The share of enterprises that had adopted marketing or organisational innovations was 38 per cent while in previous time periods the proportions were 33 and 40 per cent.
Figure 1. Enterprises with innovation activity 2006 to 2012, share of enterprises

All in all, 45 per cent of the surveyed enterprises were involved in innovation activity related to products and processes (including, in addition to adoption of innovations, also projects and measures aiming at their implementation). One-half of the respondent enterprises had developed and taken into use products and processes in manufacturing and 40 per cent of enterprises in service industries.
The share of enterprises reporting development of marketing and organisation was almost equal for manufacturing and service enterprises. Around 30 per cent of enterprises had adopted organisational innovations and one-quarter of enterprises reported marketing innovations.
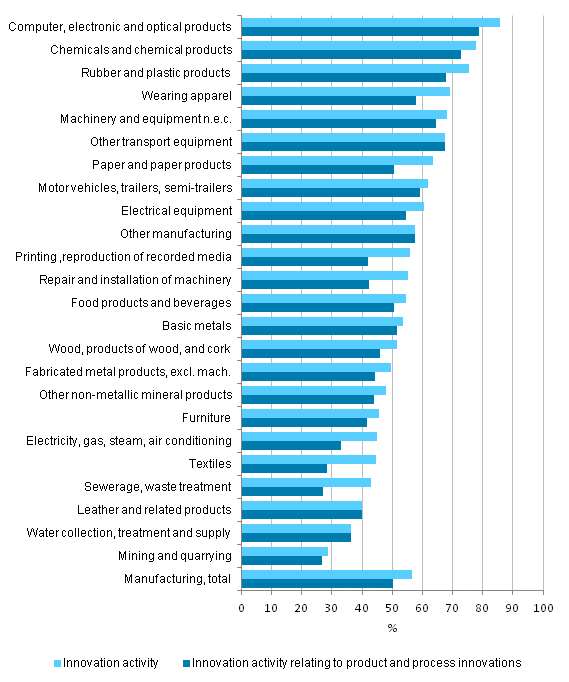
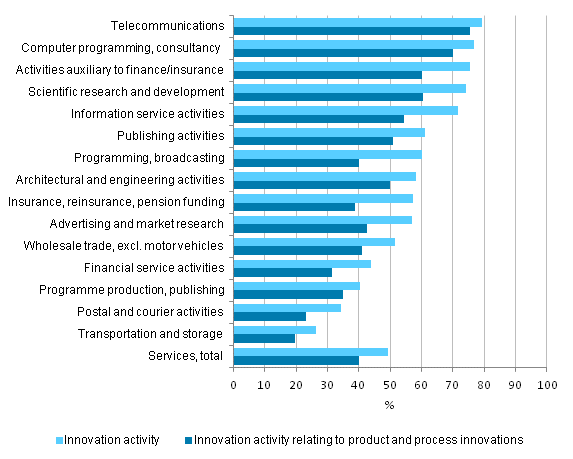
In all, good one-half of the surveyed enterprises were involved in innovation activity in 2010 to 2012. In service enterprises, the share was around one-half of respondents, while the share among manufacturing enterprises was a bit higher, 57 per cent. In manufacturing, innovation activities were most prevalent in manufacture of computer, electronic and optical products, manufacture of chemicals and chemical products, and manufacture of rubber and plastic products. Among service industry enterprises, those in the sectors of telecommunications, computer programming, financing, insurance, and research and development reported most innovation activities. The industries mentioned above have also previously been among those that are involved in innovation activity most frequently.
Figure 2. Prevalence of innovation activity by industry in manufacturing 2010–2012, share of enterprises

Figure 3. Prevalence of innovation activity by industry in services 2010–2012, share of enterprises

Innovation activity is still clearly more common in large enterprises than in small enterprises. Of the largest enterprises in the survey, close on 80 per cent have had some type of innovation activity in 2010 to 2012, while the corresponding proportion in enterprises that employ ten to 49 persons has been close on one-half. Among medium size enterprises, around two in three reported innovation activity.
In line with previous surveys, enterprises belonging to foreign groups reported considerably more innovation activity than enterprises belonging to Finnish groups and especially independent enterprises not belonging to any group. For example, 43 per cent of enterprises belonging to foreign groups reported that they had launched product innovations to the markets and 54 per cent reported innovation activity related to products and processes. In the category of independent enterprises the corresponding shares were 26 per cent and 39 per cent.
Innovation activity also became more commonplace the wider the geographical markets on which the enterprise sold its products were. For enterprises that only sold their products on the domestic markets, the share of enterprises involved in innovation activity was 40 per cent. Among enterprises that reported countries in the European Union or corresponding countries in Europe but not a wider intentional market as their market, a total of 61 per cent also reported innovation activity. Most commonly innovation activities were reported by enterprises who had a wider market than that in Europe. For these enterprises, the share of those involved in innovation activity was 72 per cent.
The frequency of innovation activity also varies according to the role the enterprise has in production. Just like in the previous survey, main suppliers operating in the value chain that are sellers of end products also responsible for planning, as well as system suppliers that supply entities to the main suppliers, reported innovation activity more often in 2010 to 2012 than enterprises acting as subcontractors. For example, nearly 60 per cent of main suppliers and system suppliers had taken into use or launched innovations on the markets. Among subcontractors, 40 per cent had made innovations.
Source: Innovation 2012, Statistics Finland
Inquiries: Mervi Niemi 09 1734 3263 (9.6.2014 => 029 551 3263), tiede.teknologia@stat.fi
Director in charge: Hannele Orjala
Updated 5.6.2014
Official Statistics of Finland (OSF):
Innovation [e-publication].
ISSN=1797-4399. 2012,
2. Prevalence of innovation activity in enterprises in 2010 to 2012
. Helsinki: Statistics Finland [referred: 20.2.2026].
Access method: http://stat.fi/til/inn/2012/inn_2012_2014-06-05_kat_002_en.html

