

Published: 27 March 2014
Consumers’ views on the economy unchanged in March
The consumer confidence indicator stood at 8.5 in March having been 8.3 in February and 9.9 in January. In last year’s March, the consumer confidence indicator received the value 10.2. The long-term average for the confidence indicator is 12.2. The data are based on Statistics Finland’s Consumer Survey, for which 1,365 people resident in Finland were interviewed between 3 and 19 March.
Consumer confidence indicator (CCI)
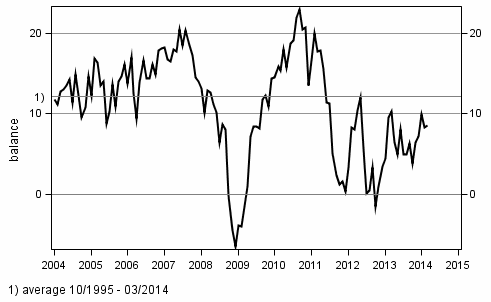
There were only slight changes in all four components of the consumer confidence indicator in March compared to February. Consumers’ views concerning Finland’s and their own economy were cautious and expectations concerning unemployment were still gloomy. By contrast, views on own saving possibilities remained good.
In March, consumers still thought that the time was more favourable for raising a loan than for saving or buying durable goods.
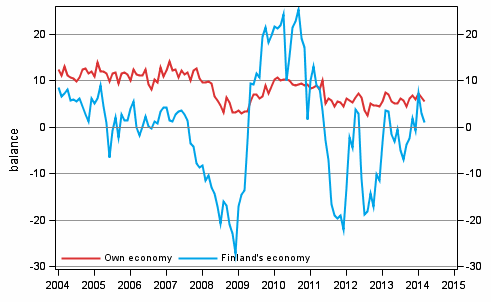
Consumers' own and Finland's economy
In March, 31 per cent of consumers believed that Finland’s economic situation would improve in the coming twelve months, while 26 per cent of them thought that the country’s economy would deteriorate.
In all, 23 per cent of consumers believed in March that their own economy would improve and 13 per cent of them feared it would worsen over the year.
Consumers' expectations concerning their own and Finland's economy in 12 months' time
Unemployment and inflation
Altogether 51 per cent of consumers thought in March that unemployment would increase over the year, and 14 per cent of them believed it would decrease. The respective proportions in February were 56 and 13 per cent.
Twenty-one per cent of employed persons reckoned in March that their personal threat of unemployment had increased over the past few months, while 10 per cent thought it had decreased. Forty-five per cent of employed persons thought the threat had remained unchanged and 24 per cent felt that they were not threatened by unemployment at all.
Consumers predicted in March that consumer prices would go up by 2.7 per cent over the next 12 months. The long-term predicted average inflation rate is 2.3 per cent.
Buying of durable goods
In March, 37 per cent of consumers thought the time was favourable for buying durable goods. Fewer households than usual, or only 13 per cent of households were fairly or very certain to buy a car and six per cent a dwelling during the next 12 months. In February, 21 per cent of households were planning to spend money on renovations to their dwelling within a year.
Saving and taking out a loan
Altogether 55 per cent of consumers considered saving worthwhile in March. In all, 66 per cent of households had been able to lay aside some money and 80 per cent believed they would be able to do so during the next 12 months.
In March, 58 per cent of consumers regarded the time good for raising a loan. Twelve per cent of households were planning to raise a loan within one year.
Consumers' views of the economy
| Average 10/1995- | Max. 10/1995- | Min. 10/1995- | 03/2013 | 02/2014 | 03/2014 | Outlook | |
| A1 Consumer confidence indicator, CCI = (B2+B4+B7+D2)/4 | 12,2 | 22,9 | -6,5 | 10,2 | 8,3 | 8,5 | - |
| B2 Own economy in 12 months' time (balance) | 8,6 | 14,1 | 2,3 | 7,0 | 6,4 | 5,5 | -- |
| B4 Finland's economy in 12 months' time (balance) | 3,5 | 25,3 | -27,1 | 3,5 | 2,9 | 1,0 | = |
| B6 Inflation in 12 months' time (per cent) | 2,3 | 4,6 | 0,6 | 3,0 | 2,6 | 2,7 | |
| B7 Unemployment in Finland in 12 months' time (balance) | -2,1 | 27,6 | -51,1 | -17,8 | -24,6 | -20,5 | -- |
| B8 Own threat of unemployment now (balance) | -0,3 | 7,6 | -18,8 | -7,2 | -8,5 | -5,9 | - |
| C1 Favourability of time for purchasing durables (balance) | 18,7 | 41,8 | -14,2 | -1,3 | 7,8 | 2,7 | -- |
| C2 Favourability of time for saving (balance) | 11,3 | 36,8 | -19,6 | 5,7 | 7,5 | 6,6 | - |
| C3 Favourability of time for raising a loan (balance) | 17,0 | 42,0 | -47,1 | 12,0 | 11,5 | 12,6 | - |
| D2 Household's saving possibilities in the next 12 months (balance) | 38,7 | 52,2 | 10,9 | 48,3 | 48,6 | 48,2 | + |
The balance figures are obtained by deducting the weighted proportion of negative answers from that of positive answers. The consumer confidence indicator is the average of the balance figures for the CCI components. The balance figures and the confidence indicator can range between -100 and +100 – the higher (positive) balance figure, the brighter the view on the economy.
Explanations for Outlook column: ++ Outlook is very good, + Outlook is good, = Outlook is neutral, - Outlook is poor, -- Outlook is very poor. Deviation of balance from average has been compared to standard deviation.
The population and sample of the Survey
The population of the Consumer Survey comprises 4.4 million persons aged 15 to 84 and their 2.6 million households in Finland. The population was extended to persons aged 75 to 84 starting from January 2012. The gross size of the monthly sample of the Survey is 2,350 persons (previously 2,200 persons).
In March, the non-response rate of the Consumer Survey was 41.9 per cent. The non-response rate includes those who refused from the survey or were otherwise prevented from participating, as well as those who could not be contacted.
The extension of the population, that is, responses from persons aged 75 to 84, is estimated to have weakened the value of the consumer confidence indicator by good one unit starting from January 2012. This has primarily been caused by a drop in the balance figure of one component, namely own household's saving possibilities. The extension of the population has also somewhat affected the results on owning various home technology.
EU results
The (seasonally adjusted) Consumer Survey results for all EU countries are released on the European Commission website: European Commission, DG ECFIN, Business and Consumer Survey Results; http://ec.europa.eu/economy_finance/db_indicators/surveys/index_en.htm
Source: Consumer Survey 2014, March. Statistics Finland
Inquiries: Pertti Kangassalo 09 1734 3598, Tara Junes 09 1734 3503, consumer.survey@stat.fi
Director in charge: Riitta Harala
Publication in pdf-format (441.4 kB)
- Reviews
-
- 1. Method of the Consumer Survey (27.3.2014)
- Tables
-
Tables in databases
Pick the data you need into tables, view the data as graphs, or download the data for your use.
Appendix tables
- Figures
-
- Appendix figure 1. Consumer confidence indicator (CCI) (27.3.2014)
- Appendix figure 2. Micro and macro indicators (27.3.2014)
- Appendix figure 3. Own economy (27.3.2014)
- Appendix figure 4. Finland's economy (27.3.2014)
- Appendix figure 5. Inflation (27.3.2014)
- Appendix figure 6. Unemployment (27.3.2014)
- Appendix figure 7. Favourability of time for (27.3.2014)
- Appendix figure 8. Household's financial situation (27.3.2014)
- Appendix figure 9. Household's intentions to raise a loan, next 12 months (27.3.2014)
- Appendix figure10. Spending on durables, next 12 months vs last 12 months (27.3.2014)
- Appendix figure 11. Household's intentions to buy, next 12 months (27.3.2014)
Updated 27.3.2014
Official Statistics of Finland (OSF):
Consumer Confidence [e-publication].
ISSN=2669-8889. March 2014. Helsinki: Statistics Finland [referred: 25.7.2026].
Access method: http://stat.fi/til/kbar/2014/03/kbar_2014_03_2014-03-27_tie_001_en.html