Published: 19 May 2015
Cubic volume covered by granted building permits grew by 4 per cent in the first quarter of 2015
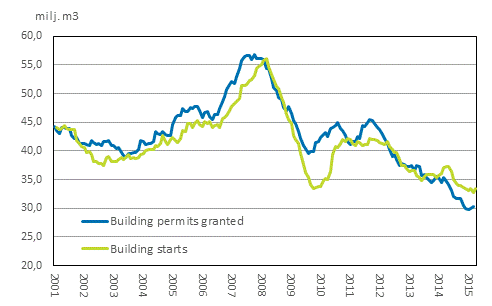
In the first quarter of 2015, building permits were granted for a total of 6.8 million cubic metres, which is 4 per cent more than one year earlier. At the same time, 5 per cent more building projects were started than last year and the constant-price volume of building production still remained 13 per cent lower than one year ago. This is based on the estimated statistics on building and dwelling production, in the compilation of which the data have been corrected by statistical methods based on the data for the previous year.
Building permits granted and building starts, mil. m3, moving annual total

The beginning of the current year already seems more promising than previous years. Eleven per cent more building projects were started during January to March than in the corresponding period of the year before. At the same time, the constant-price value or the volume of ongoing building production still decreased by 11 per cent from one year back.
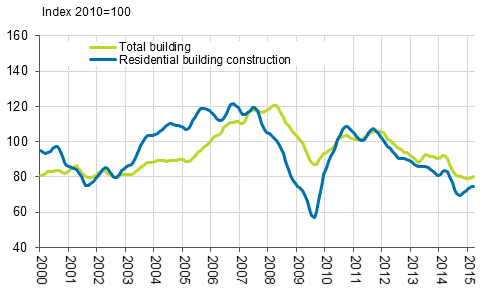
Volume index of newbuilding 2010=100, trend

Number of granted building permits was 16 per cent lower in 2014 than one year before
During 2014, building permits were granted for a total of 30 million cubic metres. Their number fell by 15.5 per cent from the previous year. The cubic volume covered by permits granted for residential buildings remained on level with the previous year, down by just 1.6 per cent, and the cubic volume covered by permits granted for other than residential buildings went down by 21.1 per cent from one year ago.
Production interruption of the statistics on building and dwelling production continues
The now published information is based on data supplemented by statistical methods. The deficient data were estimated with data on building grants in the year before. Due to the estimation, not all data were available with the most detailed purpose of use and regional divisions. The data now available will be supplemented over coming months and the data in the statistics may still become revised.
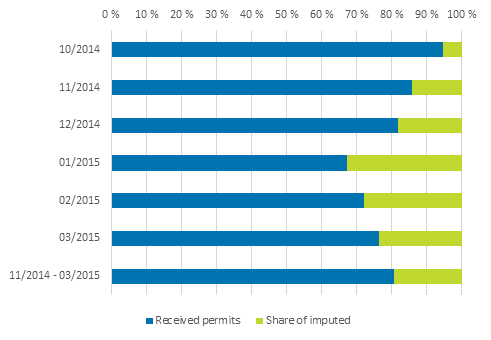
The figure below shows the shares of granted building permits received and imputed by Statistics Finland from October to March by month. The imputation rate in the complete data is around 20 per cent for the period mentioned.
Share of imputed building permits (capacity)

Statistics Finland has been unable to restart the production of the statistics on building and dwelling production yet because the Population Register Centre has not been able to deliver sufficiently extensive building register data to Statistics Finland used as the data source of the statistics.
The production interruption of the statistics on building and dwelling production that began in January continues for the time being, but we will return to the normal monthly release schedule once the data deliveries and systems are working.
Source: Building and dwelling production, Statistics Finland
Inquiries: Mira Kuussaari 029 551 3538, Merja Järvinen 029 551 2458, Heli Suonio 029 551 2481, rakennus.suhdanne@stat.fi
Director in charge: Hannele Orjala
Publication in pdf-format (253.5 kB)
- Tables
-
Tables in databases
Pick the data you need into tables, view the data as graphs, or download the data for your use.
Appendix tables
- Appendix table 1. Building permits, 1000 m3 (19.5.2015)
- Appendix table 2. Buildings starts, 1000 m3 (19.5.2015)
- Appendix table 3. Building completions, 1000 m3 (19.5.2015)
- Appendix table 4. Dwelling construction by building type, number, building permits and building starts (19.5.2015)
- Appendix table 5. Volume index of newbuilding 2010=100 (19.5.2015)
Updated 19.5.2015
Official Statistics of Finland (OSF):
Building and dwelling production [e-publication].
ISSN=1798-9590. March 2015. Helsinki: Statistics Finland [referred: 21.2.2026].
Access method: http://stat.fi/til/ras/2015/03/ras_2015_03_2015-05-19_tie_001_en.html

