Published: 12 July 2012
Households’ financial assets contracted due to holding losses in 2011
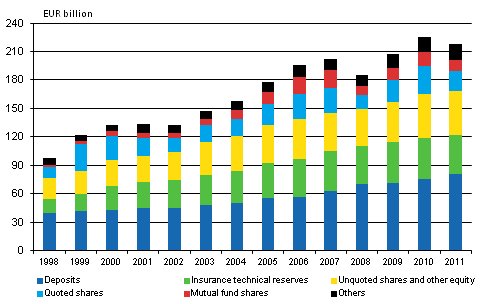
Households’ financial assets stood at EUR 218 billion at the end of 2011. Their financial assets decreased by around EUR 7 billion during 2011. The decrease was due to holding losses caused by fallen value of investments and amounted to nearly EUR 13 billion. Net investments, in turn, boosted households’ financial assets by EUR 5 billion. These data derive from Statistics Finland’s Financial Accounts statistics
Financial assets of households 1998-2011, EUR billion

.
Popularity of deposits continued
Households invested the largest amount of their assets in deposits. EUR 80 billion, or 37 per cent, of the EUR 218 billion of households’ financial assets were deposits. In last year, too, the vast majority of households’ net investments were deposits. Households’ net investments in quoted shares also remained positive, but they withdrew their assets from mutual funds. Besides deposits, at the end of the year households had EUR 46 billion invested in unquoted shares and equity, EUR 42 billion in insurance technical reserves, EUR 21 billion in quoted shares and EUR 12 billion in mutual fund shares.
Indebtedness rate went up
At the end of 2011, households’ loan debts amounted to EUR 117 billion. Loan debts increased by EUR 6 billion from the previous year. Indebtedness rate, i.e. proportion of loans relative to disposable income, rose by 2.4 percentage points to 115.6 per cent. In consequence of the contraction of their financial assets and the growth of their debts, households’ financial position weakened. During the year, households’ net financial assets, i.e. difference between their financial assets and liabilities diminished by some EUR 14 billion, corresponding to a contraction of 13 per cent.
Source: Financial Accounts, Statistics Finland
Inquiries: Saara Roine 09 1734 3325, rahoitus.tilinpito@stat.fi
Director in charge: Ari Tyrkkö
Publication in pdf-format (367.6 kB)
- Reviews
- Tables
-
Tables in databases
Pick the data you need into tables, view the data as graphs, or download the data for your use.
Appendix tables
- Appendix table 1. Financial assets of households, million EUR (12.7.2012)
- Appendix table 2. Liabilities of households, million EUR (12.7.2012)
- Appendix table 3. Households net acquisition of financial assets, million EUR (12.7.2012)
- Appendix table 4. Households net incurrence of liabilities, million EUR (12.7.2012)
- Appendix table 5. Financial assets of Non-financial corporations, million EUR (12.7.2012)
- Appendix table 6. Financial liabilities of Non-financial corporations, million EUR (12.7.2012)
- Appendix table 7. Net financial assets by sector, million EUR (12.7.2012)
- Appendix table 8. Net financial transactions by sector, million EUR (12.7.2012)
- Appendix table 9. Statistical discrepancy by sector, million EUR (12.7.2012)
- Figures
-
- Appendix figure 1. Financial assets of households 1998-2011, EUR billion (12.7.2012)
- Appendix figure 2. Change in financial assets of households 1998-2011 (12.7.2012)
- Appendix figure 3. Households' net acquisition of deposits, quoted shares and mutal funds, EUR billion (12.7.2012)
- Appendix figure 4. Emissions of quoted shares, EUR billion (12.7.2012)
- Appendix figure 5. Households indebtedness ratio 1977-2011 (12.7.2012)
- Appendix figure 6. Private sector debt as percentage of GDP (12.7.2012)
Updated 12.7.2012
Official Statistics of Finland (OSF):
Financial accounts [e-publication].
ISSN=1458-8145. 2011. Helsinki: Statistics Finland [referred: 12.2.2026].
Access method: http://stat.fi/til/rtp/2011/rtp_2011_2012-07-12_tie_001_en.html

