Published: 21 April 2016
Number of marriages entered into rose slightly
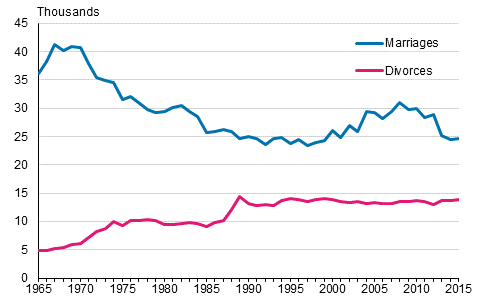
According to Statistics Finland's data on population changes, the number of marriages entered into grew in 2015, while it had dropped in two previous years. A total of 24,708 marriages were entered into, which was 246 more than in the year before. The marriage rate was slightly livelier for those aged around 40 compared with the previous year, while it either went down slightly or remained unchanged for younger or older people than that.
Number of marriages and divorces 1965–2015

Number of remarriages rising
The number of first marriages went down from the year before, while the number of remarriages was higher than in the previous year. Because the changes in numbers were so small, the share of first marriages in all marriages entered into remained unchanged at three-quarters. The relative share has remained at the same level throughout the early 2000s. One-fifth of all marriages contracted were second marriages, four per cent third marriages.
In 2015, the rise in the average age of women and men entering into their first marriage continued, as the average age of both spouses rose by 0.5 years from the year before. The average age of women entering into their first marriage was 31.2 years and 33.4 years for men.
Number of divorces grew
In 2015, the number of divorces increased while it had decreased slightly in the previous year. Altogether, 13,939 marriages ended in divorce, which was 257 more than one year previously. The divorce rate has remained at the same level for over 20 years. Changes by age in the divorce rate were minor compared with the previous year. The divorce rate went down slightly for those aged under 30, but it was somewhat higher for those aged 45 to 64 than in the previous year.
The average age of women in their first marriage was 40.4 when their marriage ended in divorce. The corresponding average age of men was 42.8 in 2015. The average age of women and men at the time of divorce rose from the year before, but the average age of either sex has not been clearly rising or falling in the last few years.
Clearly under one-half of first marriages still end in divorce
The probability that the first marriage ends in divorce has remained unchanged in the past decade. According to the divorce rate in 2015, first marriages end in divorce with a probability of 39 per cent, as in the year before. The rise in the divorce rate from the previous year was so small that the probability of first marriages to end in divorce stays at the same level. The median for the duration of first marriages ending in divorce was ten years.
Sixty-eight per cent of the marriages that ended in divorce in 2015 were first marriages for both spouses. The share has remained unchanged compared with the previous year. In 1990, the corresponding percentage was still 80. Eleven per cent of the marriages ending in divorce were at least second marriages for both spouses in 2015.
Fewer registrations of partnerships, more divorces
The number of registered same-sex partnerships has remained relatively stable in recent years, slightly over 300 per year, except for 2013 when registrations numbered 373. In 2015, the registrations numbered 318. Of these, 97 were male couples and 221 female couples.
Slightly over 100 registered same-sex partnerships have ended in divorce annually in three previous years. In 2015, the number of divorces grew to 133, by around one-fifth from the previous year. Of them, 40 were of male couples and 93 of female couples.
Changes in marital status, mean age of men and women at first marriage in 2006–2015
| Year | ||||||||||
| 2006 | 2007 | 2008 | 2009 | 2010 | 2011 | 2012 | 2013 | 2014 | 2015 | |
| Contracted marriages | 28 236 | 29 497 | 31 014 | 29 836 | 29 952 | 28 408 | 28 878 | 25 119 | 24 462 | 24 708 |
| Divorces | 13 255 | 13 224 | 13 471 | 13 527 | 13 619 | 13 469 | 13 040 | 13 766 | 13 682 | 13 939 |
| Woman's mean age at first marriage | 29,7 | 29,9 | 30,2 | 30,2 | 30,3 | 30,6 | 30,8 | 30,6 | 30,7 | 31,2 |
| Man's mean age at first marriage | 32,1 | 32,3 | 32,5 | 32,5 | 32,6 | 32,9 | 33,1 | 32,8 | 32,9 | 33,4 |
| Woman's mean age at first divorce | 40,4 | 40,5 | 40,3 | 40,0 | 39,9 | 40,4 | 40,0 | 40,0 | 39,9 | 40,4 |
| Man's mean age at first divorce | 42,7 | 42,8 | 42,5 | 42,2 | 42,3 | 42,7 | 42,3 | 42,3 | 42,3 | 42,8 |
| Registered partnerships | 191 | 213 | 249 | 246 | 322 | 333 | 329 | 373 | 333 | 318 |
| Divorces from registered partnerships | 30 | 67 | 45 | 53 | 64 | 85 | 103 | 101 | 109 | 133 |
Source: Changes in marital status 2015. Statistics Finland
Inquiries: Timo Nikander 029 551 3250, info@stat.fi
Director in charge: Jari Tarkoma
Publication in pdf-format (285.8 kB)
- Tables
-
Tables in databases
Pick the data you need into tables, view the data as graphs, or download the data for your use.
Appendix tables
- Figures
- Quality descriptions
-
- Quality description, changes in marital status (21.4.2016)
Updated 21.4.2016
Official Statistics of Finland (OSF):
Changes in marital status [e-publication].
ISSN=1797-643X. 2015. Helsinki: Statistics Finland [referred: 17.2.2026].
Access method: http://stat.fi/til/ssaaty/2015/ssaaty_2015_2016-04-21_tie_001_en.html

