Published: 26 January 2010
Energy use in manufacturing diminished by 7 per cent in 2008
According to Statistics Finland data, energy use in manufacturing totalled 570 petajoule (PJ) in 2008 (confidence interval ± 0.8 per cent). Compared to 2007, energy use in manufacturing diminished by 7 per cent. The main contributor to the reduction was the forest industry where energy use fell by 9 per cent. Wood fuels were the most used source of energy in manufacturing. Of all the industries, the forest industry used the largest amount of energy. It accounted for some 56 per cent of the total energy used in all manufacturing. Examined by region, energy use in manufacturing was highest in North Ostrobothnia, South Karelia and Itä-Uusimaa.
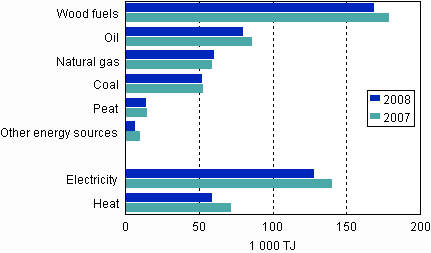
The most used fuels in manufacturing were wood, oil, natural gas and coal. The use of net electricity and heat diminished from the previous year. The use of electricity and heat is calculated in total use of energy as net purchases. This means that the amount of energy sold or delivered by an establishment is deducted from the amount of energy purchased or received.
Use of energy sources in manufacturing

The regions of North Ostrobothnia and South Karelia both used some 13 per cent of the energy used in all manufacturing. Manufacturing used the next largest amounts of energy in the regions of Itä-Uusimaa and Kymenlaakso, or 10 and 9 per cent, respectively, of all energy used in manufacturing. Of the regions, Etelä-Savo, South Ostrobothnia and Åland used the least amounts of energy.
In 2008, the forest industry accounted for almost 57 per cent of the total use of electricity in manufacturing. Of the regions, the highest amounts of electricity were used by manufacturing establishments in Kymenlaakso and Central Finland, both of which accounted for over 10 per cent of all electricity used in manufacturing.
Total consumption of electricity in manufacturing
| Industries | 1000 MWh | Change % | 95% confidence interval, ± % |
| Forest industry | 25 172,4 | -10,9 | 0,9 |
| Chemical industry | 6 646,6 | -1,0 | 3,0 |
| Manufacture of basic metals | 5 433,1 | -5,3 | 1,7 |
| Machinery and metal manufacturing | 2 431,2 | 5,2 | 10,1 |
| Other manufacturing | 1 577,9 | -9,6 | 13,7 |
| Food industry | 1 397,2 | -14,8 | 18,6 |
| Manufacture of electrical and optical equipment | 789,0 | -6,1 | 19,4 |
| Mining and quarrying | 524,5 | -29,5 | 21,1 |
| Manufacture of textiles and wearing apparel | 216,6 | -1,4 | 27,9 |
| Total | 44 226,0 | -8,6 | 1,2 |
These statistics are based on an inquiry about energy use in manufacturing. The data were collected with the annual inquiry from establishments in the industry categories of Mining and quarrying (B) and Manufacturing (C) of the standard industrial classification TOL2008, as well as from the power plants closely connected with the activities of these establishments. The inquiry does not extend to category D, Electricity, gas and steam supply, of the classification. The data for 2008 were collected from a sample consisting of some 2,200 establishments. The data are published by energy source, industry and region.
Source: Energy use in manufacturing, Statistics Finland
Inquiries: Bate Ismail (09) 1734 3228, energia@tilastokeskus.fi
Director in charge: Leena Storgårds
Publication in pdf-format (272.7 kB)
- Tables
-
Appendix tables
- Figures
-
- Figure 1. Use of energy sources in manufacturing (26.1.2010)
- Figure 2. Energy use in manufacturing by energy source 2008 (26.1.2010)
- Figure 3. Energy use in manufacturing by industry (26.1.2010)
- Figure 4. Energy use in manufacturing by region (26.1.2010)
- Figure 5. Total electricity consumption in manufacturing 2008 (26.1.2010)
- Figure 6. Total electricity consumption by manufacturing branch 2008 (26.1.2010)
- Figure 7. Total electricity consumption in manufacturing by region (26.1.2010)
Updated 26.01.2010
Official Statistics of Finland (OSF):
Energy use in manufacturing [e-publication].
ISSN=1798-7776. 2008. Helsinki: Statistics Finland [referred: 13.2.2026].
Access method: http://stat.fi/til/tene/2008/tene_2008_2010-01-26_tie_001_en.html

