Published: 15 May 2014
Young people experience more age discrimination at work than before
The preliminary results of Statistics Finland's Quality of Work Life Survey 2013 draw a cautiously positive picture of decreased gender-related discrimination at workplaces. Women's personal experiences of discrimination have decreased in the 2000s, particularly in terms of remuneration. The personal experiences of persons aged over 50 of age discrimination at workplaces have also decreased. On the other hand, an increasing number of employees aged under 30 are experiencing that they are treated unequally due to their young age.
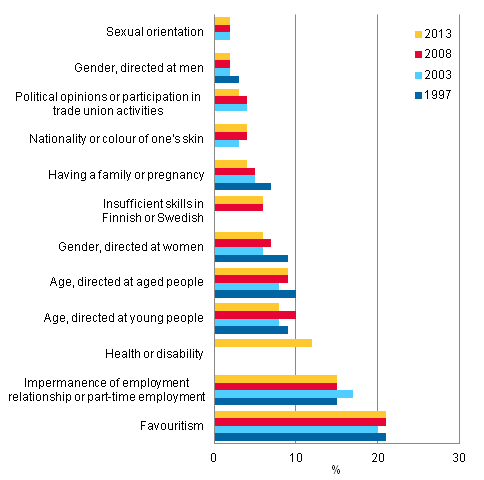
Figure 1. Share of employees that have observed unequal treatment or discrimination at their workplace (%), by grounds for discrimination

Source: Quality of Work Life Surveys 1997, 2003, 2008 and 2013, Statistics Finland
Gender-based discrimination directed at women has decreased over the past some 15 years according to both female and male employees. According to the Quality of Work Life Survey 2013, this type of discrimination had been detected at the workplace by six per cent of employees, while the corresponding figure in 1997 was nine per cent. Also, clearly less discrimination based on a person having a family or being pregnant is found today (4%) than in 1997 (7%).
Most commonly, employees have noticed unequal treatment or discrimination based on favouritism, which is reported by one-fifth (21%) of employees. The second most common (15%) form of discrimination was based on the impermanence of the employment relationship or on part-time employment. In these terms, the situation has remained almost unchanged since 1997. The third most common form of detected discrimination was based on health or disability (12%), which was inquired in this form for the first time only in 2013.
Nearly one-tenth of employees have observed age discrimination towards aged people (9%) at their workplace, but nearly as many have also detected age discrimination directed at young people (8%). The share of these observations has only contracted marginally from 1997.
Six per cent of all employees have noticed discrimination based on insufficient skills in the national language and four per cent have detected discrimination based on nationality or the colour of one’s skin. Only little gender discrimination directed at men (2%) and discrimination based on political opinion or participation in trade union activities (3%) is observed in Finnish workplaces, as well as discrimination based on sexual orientation (2%). Women have noticed various forms of discrimination more frequently than men.
Table 1. Share of employees that have observed unequal treatment or discrimination at their workplace (%), by gender and grounds for discrimination
| 1997 | 2003 | 2008 | 2013 | ||
| Favouritism | Women | 23 | 24 | 25 | 24 |
| Men | 18 | 16 | 17 | 17 | |
| Impermanence of employment relationship or part-time employment | Women | 16 | 21 | 19 | 19 |
| Men | 13 | 11 | 11 | 11 | |
| Health or disability | Women | .. | .. | .. | 14 |
| Men | .. | .. | .. | 9 | |
| Age, directed at young people | Women | 8 | 8 | 10 | 8 |
| Men | 11 | 9 | 10 | 8 | |
| Age, directed at aged people | Women | 11 | 10 | 11 | 10 |
| Men | 10 | 6 | 8 | 7 | |
| Gender, directed at women | Women | 12 | 9 | 9 | 8 |
| Men | 6 | 3 | 4 | 3 | |
| Insufficient skills in Finnish or Swedish | Women | .. | .. | 6 | 7 |
| Men | .. | .. | 5 | 5 | |
| Having a family or pregnancy | Women | 10 | 7 | 7 | 6 |
| Men | 3 | 3 | 2 | 3 | |
| Nationality or colour of one's skin | Women | .. | 4 | 5 | 3 |
| Men | .. | 3 | 3 | 4 | |
| Political opinions or participation in trade union activities | Women | .. | 3 | 4 | 3 |
| Men | .. | 4 | 4 | 4 | |
| Gender, directed at men | Women | 3 | 2 | 1 | 2 |
| Men | 3 | 2 | 3 | 2 | |
| Sexual orientation | Women | .. | 3 | 2 | 1 |
| Men | .. | 2 | 3 | 2 | |
Young people experience more age discrimination than aged people
Persons that have observed discrimination in their workplace are further asked whether they have personally experienced discrimination or unequal treatment. The share of women who have experienced gender discrimination themselves (4%) has decreased by one percentage point from the late 1990s (5%). During the entire survey period, a couple of per cent of male employees have personally experienced discrimination directed at men.
Two per cent of all employees have experienced age discrimination directed at young people and two per cent age discrimination directed at aged people. Examined by age group, it is interesting that among aged people, personal experiences of discrimination directed at old age have decreased but age discrimination experienced by young people has actually increased. Of persons aged under 30, six per cent (women 5%, men 7%) reported that they had experienced discrimination directed at their young age in 1997, while in 2013 the corresponding share had increased to eight per cent (women 10%, men 5%). Correspondingly, of employees aged over 50, seven per cent (women 8%, men 6%) reported that they had experienced discrimination directed at their old age in 1997, but only four per cent (women 5%, men 2%) in 2013.
Discrimination most common in acquisition of information
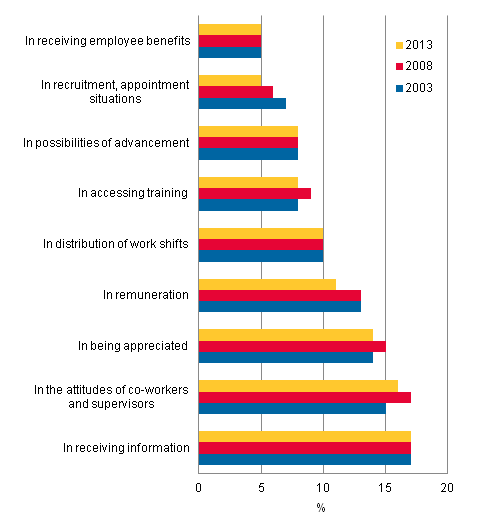
Employees’ personal experiences of discrimination are usually connected with receiving information (17%) and the attitudes of co-workers and supervisors (16%). People also quite often experience discrimination in being appreciated (14%). The change has been very low in this regard in the 2000s. By contrast, the discrimination experienced in remuneration has diminished by a couple of percentage points since 2008. This is especially visible for women, among whom the share has decreased from 15 to 12 per cent in ten years. Women report having experienced discrimination more often in all inquired situations than men.
Figure 2. Has personally experienced unequal treatment or discrimination in the past five years at the workplace. Share (%) of employees by discrimination situation

Source: Quality of Work Life Surveys 2003, 2008 and 2013, Statistics Finland
Source: Quality of Work Life Survey, Statistics Finland
Inquiries: Hanna Sutela 09 1734 2907, Anna-Maija Lehto 09 1734 3223, tyoelama@stat.fi
Director in charge: Riitta Harala
Publication in pdf-format (314.1 kB)
- Reviews
-
- 1. Discrimination at workplaces (15.5.2014)
- Tables
-
Tables in databases
Pick the data you need into tables, view the data as graphs, or download the data for your use.
Appendix tables
Updated 20.5.2014
Official Statistics of Finland (OSF):
Quality of work life [e-publication].
ISSN=2342-2890. 02 2013. Helsinki: Statistics Finland [referred: 15.2.2026].
Access method: http://stat.fi/til/tyoolot/2013/02/tyoolot_2013_02_2014-05-15_tie_001_en.html

