Published: 15 February 2011
Employment and unemployment in 2010 on level with the year before
According to Statistics Finland’s Labour Force Survey, the decline in employment halted in 2010. The rate of unemployment also stayed almost on level with 2009. These data derive from the annual review Employment and Unemployment in 2010 of Statistics Finland’s Labour Force Survey.
The decline in the employment rate halted in 2010. At 67.8 per cent, the employment rate was only 0.5 percentage points lower than in 2009. Men’s employment rate was on level with the year before at 68.7 per cent. Women's employment rate fell by one percentage point to 66.9 per cent.
Employed persons numbered 2,447,000 in 2010. The number fell by 10,000 persons from 2009. The decline in employment levelled off in 2010, as in 2009 the number of employed persons had decreased by 74,000.
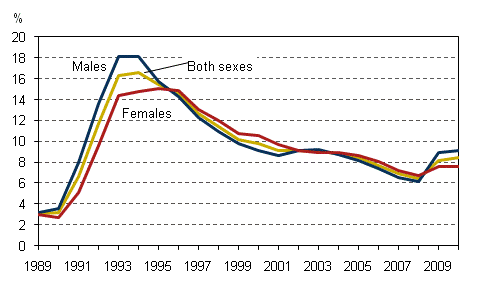
No appreciable changes took place in the unemployment situation between 2009 and 2010. In 2010, the average rate of unemployment was 8.4 per cent, having been 8.2 per cent in 2009. Men’s unemployment rate was 9.1 per cent and women’s 7.6 per cent.
In 2010, the average number of unemployed persons was 224,000, which was almost the same as in 2009. There were 126,000 unemployed men and 98,000 unemployed women. Compared to 2009, there were 4,000 more unemployed men. Hardly any change took place in the number of unemployed women.
Rates of unemployment by gender in 1989–2010, population aged 15 to 74, %

Source: Labour Force Survey 2010. Statistics Finland
Inquiries: Anna Pärnänen (09) 1734 2607, Heidi Melasniemi-Uutela (09) 1734 2523, tyovoimatutkimus@stat.fi
Director in charge: Riitta Harala
Publication in pdf-format (644.4 kB)
- Reviews
-
- 1. The decline in employment halted in 2010 (15.2.2011)
- 2. Changes in unemployment were minor in 2010 (15.2.2011)
- 3. Number of women in the inactive population grew (15.2.2011)
- 4. Notes to the appendix tables (15.2.2011)
- Tables
-
Tables in databases
Pick the data you need into tables, view the data as graphs, or download the data for your use.
Appendix tables
- Appendix table 1. Key indicators in the Labour Force Survey by sex in 2008 - 2010 (15.2.2011)
- Appendix table 2. Population aged 15-74 by labour force status and sex in 2008 - 2010 (15.2.2011)
- Appendix table 3. Population aged 15-74 by sex and age in 2008 - 2010 (15.2.2011)
- Appendix table 4. Active population by sex and age in 2008 - 2010 (15.2.2011)
- Appendix table 5. Activity rates by sex and age in 2008 - 2010 (15.2.2011)
- Appendix table 6. Employed persons by sex and age 2008 - 2010 (15.2.2011)
- Appendix table 7. Employment rates by sex and age in 2008 - 2010 (15.2.2011)
- Appendix table 8. Employed persons aged 15-74 by socio-economic group and sex in 2008 - 2010 (15.2.2011)
- Appendix table 9. Employed person aged 15-74 by educational level and sex in 2007 - 2009 (15.2.2011)
- Appendix table 10. Employed persons aged 15-74 by industry (TOL 2008) in 2008 - 2010 (15.2.2011)
- Appendix table 11. Hours actually worked by employed persons aged 15-74 by industry (TOL 2008) in 2008 - 2010 (15.2.2011)
- Appendix table 12. Employed persons aged 15-74 by employer sector and sex in 2008 - 2010 (15.2.2011)
- Appendix table 13. Employed persons aged 15-74 by Regional State Administrative Agencies (AVI) and sex in 2009 - 2010 (15.2.2011)
- Appendix table 14. Employed persons aged 15-74 by region in 2008 - 2010 (15.2.2011)
- Appendix table 15. Part-time employed persons aged 15-74 by sex in 2008 - 2010 (15.2.2011)
- Appendix table 16. Proportion of part-time employed in all employed persons by sex in 2008 - 2010, persons aged 15-74, % (15.2.2011)
- Appendix table 17. Employees aged 15-74 by industry (TOL 2008) in 2008 - 2010 (15.2.2011)
- Appendix table 18. Hours actually worked by employees aged 15-74 by industry (TOL 2008) in 2008 - 2010 (15.2.2011)
- Appendix table 19. Employees aged 15-74 by type of employment relationship and sex in 2008 - 2010 (15.2.2011)
- Appendix table 20. Employees aged 15-74 by type of employment relationship and sex in 2008 - 2010, % (15.2.2011)
- Appendix table 21. Different types of employment relationships of less than 12 months' duration by sex in 2008 - 2010, persons aged 15-74 (15.2.2011)
- Appendix table 22. Different types of employment relationships of less than 12 months' duration by sex in 2008 - 2010, persons aged 15-74, % (15.2.2011)
- Appendix table 23. Unemployed persons by sex and age in 2008 - 2010 (15.2.2011)
- Appendix table 24. Unemployment rates by sex and age 2008 - 2010 (15.2.2011)
- Appendix table 25. Unemployment rates by Regional State Administrative Agencies (AVI) and sex in 2009 - 2010, persons aged 15-74 (15.2.2011)
- Appendix table 26. Unemployment rates by region in 2008 - 2010, persons aged 15-74 (15.2.2011)
- Appendix table 27. Unemployment rates by educational level and sex in 2005 - 2009, persons aged 15-74 (15.2.2011)
- Quality descriptions
-
- Quality Description: Labour force survey (15.2.2011)
Updated 15.2.2011
Official Statistics of Finland (OSF):
Labour force survey [e-publication].
ISSN=1798-7857. 2010. Helsinki: Statistics Finland [referred: 17.2.2026].
Access method: http://stat.fi/til/tyti/2010/tyti_2010_2011-02-15_tie_001_en.html

