

Published: 23 August 2011
Unemployment rate 6.9 per cent in July
According to Statistics Finland’s Labour Force Survey, the number of unemployed persons in July was 192,000, which was 14,000 lower than one year ago. At 6.9 per cent, the unemployment rate was 0.6 percentage points lower than one year earlier. There were 29,000 more employed persons than in July of the previous year.
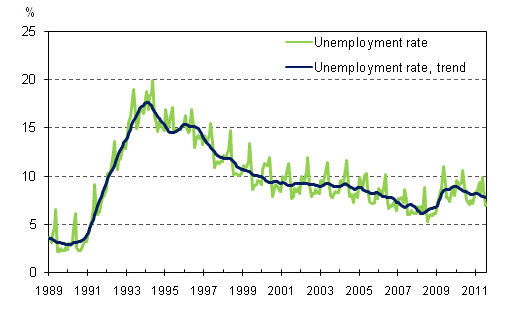
Unemployment rate and trend of unemployment rate 1989/01 – 2011/07
In July 2011, the number of employed persons was 2,578,000, which was 29,000 higher than a year earlier. This change fits within the margin of error for the number of employed persons (±30,000). There were around 6,000 more employed men and 23,000 more employed women than in July 2010.
In July, the employment rate , that is, the proportion of the employed among persons aged 15 to 64, stood at 71.8 per cent, which was 1.2 percentage points higher than one year previously. Adjusted for seasonal and random variation, the trend of the employment rate was 68.9 per cent.
According to the Labour Force Survey, there were 192,000 unemployed in July 2011, i.e. 14,000 fewer than in July of the year before. This change fits within the margin of error for the number of unemployed persons (±16,000). The number of unemployed men was 104,000 and that of women 88,000.
At 6.9 per cent, the unemployment rate was 0.6 percentage points lower in July than one year earlier. Men’s unemployment rate was 7.2 per cent and women’s 6.6 per cent. The trend of the unemployment rate was 7.8 per cent. This July, the unemployment rate among young people aged 15 to 24 was 13.7 per cent, which was 1.1 percentage points higher than in July of the previous year. The trend of the unemployment rate among young people was 20.1 per cent.
Changes in employment 2010/07 – 2011/07 according to Statistics Finland’s Labour Force Survey, population aged 15 to 74
| Year/Month | Change | ||
| 2010/07 | 2011/07 | 2010/07 - 2011/07 | |
| 1000 persons | Per cent, % | ||
| Population total | 4 044 | 4 059 | 0,4 |
| Active population total | 2 756 | 2 770 | 0,5 |
| Employed | 2 549 | 2 578 | 1,1 |
| – employees | 2 220 | 2 252 | 1,5 |
| – self-employed persons and unpaid family workers | 330 | 326 | –1,2 |
| Unemployed | 206 | 192 | –7,0 |
| Inactive population | 1 289 | 1 289 | 0,0 |
| Per cent, % | Percentage points | ||
| Employment rate, persons aged 15–64 | 70,6 | 71,8 | 1,2 |
| Unemployment rate | 7,5 | 6,9 | –0,6 |
| Activity rate | 68,1 | 68,2 | 0,1 |
| Unrounded figures are used in the
Change column. The data comply with the ILO/EU definition. |
|||
Employment Service Statistics of the Ministry of Employment and the Economy
At the end of July 2011, there were altogether 266,000 persons registered in accordance with the Employment Office Regulations as job seekers at the employment and economic development offices. The number of unemployed job seekers was 22,000 lower than in July 2010.
Unemployment decreased from the previous year in the areas of all Employment and Economic Development Centres (ELY). The number of unemployed job seekers decreased most in South Ostrobothnia (–13%), Ostrobothnia (–12%), Häme (–11%) and Pirkanmaa (–11%). At the end of July, the number of temporarily laid off persons registered at the employment and economic development offices was 12,000, which was 5,000 lower than twelve months earlier.
At the end of July, the number of persons covered by labour market policy measures totalled 91,000, which was 7,000 higher than in July of the previous year. Altogether 3.3 per cent of the labour force was covered by labour market policy measures.
There were 37,000 unemployed job seekers aged under 25 registered at the employment and economic development offices. Their number was 5,000 lower than in last year's July. During this July, 32,000 new vacancies were reported to the employment and economic development offices, which is 4,000 more than in July 2010.
Changes 2010/07– 2011/07 according to the Employment Service Statistics of the Ministry of Employment and the Economy
| Year/Month | Change | ||
| 2010/07 | 2011/07 | 2010/07 - 2011/07 | |
| 1000 persons | Per cent, % | ||
| Unemployed job seekers | 288 | 266 | –7,6 |
| – unemployed over a year | 57 | 58 | 3,3 |
| Total measures | 84 | 91 | 8,6 |
| – employed with subsidised measures | 34 | 34 | 0,9 |
| – in labour market training | 24 | 21 | –11,3 |
| – in trainee and job alternation places | 16 | 16 | 0,8 |
| – in rehabilitative work, self-motivated studies (supported by unemployment benefit) | 10 | 20 | 92,1 |
| New vacancies at employment and economic development offices | 28 | 32 | 14,4 |
| Unrounded figures are used in the Change column. | |||
Contact information for the Ministry of Employment and the
Economy:
Mr Petri Syvänen, tel. +358 10 604 8050, http://www.tem.fi/employmentbulletin
Links
Labour Force Survey 2010, Employment and unemployment in 2010
Labour Force Survey 2010, Employment relationships and working hours in 2010
Differences between the Labour Force Survey and the Employment Service Statistics are explained in the quality description of the Labour Force Survey
About seasonally adjusted trend
Latest seasonally adjusted employment figures published by the EU can be found on Eurostat's home page http://epp.eurostat.ec.europa.eu
Source: Labour force survey 2011, July. Statistics Finland
Inquiries: Kalle Sinivuori (09) 1734 3524, Ari Väisänen (09) 1734 2290, Veli Rajaniemi (09) 1734 3434, tyovoimatutkimus@stat.fi
Director in charge: Riitta Harala
Publication in pdf-format (456.5 kB)
- Tables
-
Tables in databases
Pick the data you need into tables, view the data as graphs, or download the data for your use.
Appendix tables
- Appendix table 1. Key indicators in the Labour Force Survey by sex 2010/07 - 2011/07 (23.8.2011)
- Appendix table 2. Population aged 15-74 by labour force status and sex 2010/07 - 2011/07 (23.8.2011)
- Appendix table 3. Population by sex and age 2010/07 - 2011/07 (23.8.2011)
- Appendix table 4. Active population by sex and age 2010/07 - 2011/07 (23.8.2011)
- Appendix table 5. Activity rates by sex and age 2010/07 - 2011/07 (23.8.2011)
- Appendix table 6. Employed persons by sex and age 2010/07 - 2011/07 (23.8.2011)
- Appendix table 7. Employment rates by sex and age 2010/07 - 2011/07 (23.8.2011)
- Appendix table 8. Employed persons aged 15-74 by status in employment 2010/07 - 2011/07 (23.8.2011)
- Appendix table 9. Employed persons aged 15-74 by employer sector 2010/07 - 2011/07 (23.8.2011)
- Appendix table 10. Employed persons aged 15-74 by Regional State Administrative Agencies (AVI) 2010/07 - 2011/07 (23.8.2011)
- Appendix table 11. Part-time employed persons aged 15-74 by sex 2010/07 - 2011/07 (23.8.2011)
- Appendix table 12. Proportion of part-time employed persons in all employed persons aged 15-74 by sex 2010/07 - 2011/07, % (23.8.2011)
- Appendix table 13. Employees aged 15-74 by type of employment relationship 2010/07 - 2011/07 (23.8.2011)
- Appendix table 14. Employees aged 15-74 by type of employment relationship 2010/07 - 2011/07, % (23.8.2011)
- Appendix table 15. Unemployed persons by sex and age 2010/07 - 2011/07 (23.8.2011)
- Appendix table 16. Unemployment rates by sex and age 2010/07 - 2011/07 (23.8.2011)
- Appendix table 17. Unemployment rates by Regional State Administrative Agencies (AVI) 2010/07 - 2011/07, persons aged 15-74 (23.8.2011)
- Appendix table 18. Seasonally adjusted trends 2011/07 (23.8.2011)
- Figures
- Quality descriptions
-
- Quality Description: Labour force survey (23.8.2011)
Updated 23.8.2011
Official Statistics of Finland (OSF):
Labour force survey [e-publication].
ISSN=1798-7857. July 2011. Helsinki: Statistics Finland [referred: 1.8.2026].
Access method: http://stat.fi/til/tyti/2011/07/tyti_2011_07_2011-08-23_tie_001_en.html