Published: 3 October 2013
Trends of personnel training point in different directions in EU countries
Participation in training sponsored by employers has increased somewhat in EU Member States from 2005 to 2010. The development in different Member States has not been similar, however. In some of the old Member States (EU 15) participation has increased clearly and in some it has remained somewhat unchanged. In the new states that have joined after 1995, the participation rate has been consistently growing.
On the EU level, 32 per cent of private sector employees participated in course format personnel training in 2005 and in 2010 the rate was 36 per cent. Statistics Finland collected the data pertaining to Finland.
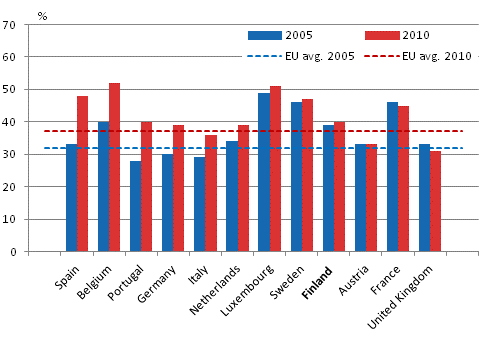
Participation in course format personnel training in 2005 and 2010, EU 15 countries

The countries are arranged based on the direction of the change and its size. Data for 2010 are missing for Denmark, Ireland and Greece. Dash lines describe the average for EU countries.
In the old EU countries, the trends related to training differ somewhat in the 2000s. In some countries (Spain, Belgium, Portugal, Germany, Italy and the Netherlands) the participation rate has grown clearly or somewhat compared to 2005. In some, the level has remained somewhat unchanged (Luxembourg, Sweden, Finland, Austria, France and United Kingdom).
The differences in the rate of participation have evened out slightly in the EU 15 countries because the level has remained unchanged in countries that previously had high rates, but in some countries that previously had a low participation rate participation in personnel training has increased. In Finland, the participation rate has remained somewhat above the average for EU countries.
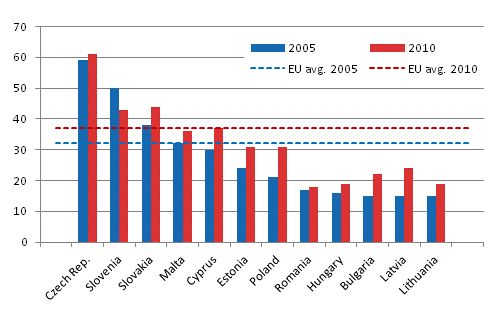
In the new countries that joined the EU after 1995, there is still a clear growing trend in participation in personnel training. An exception to this is Slovenia, where the participation rate was already above the average for the old EU countries in 2005 and unlike in the other new Member States the participation rate has now decreased to some extent.
Participation in course format personnel training in 2005 and 2010, other EU countries

The countries are arranged based on the participation rate in 2005. Dash lines describe the average for EU countries.
The Czech Republic, Slovenia and Slovakia already exceeded the EU average with their participation rates in 2005 and they still do.
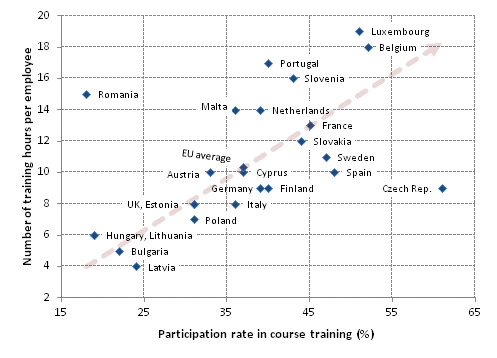
The following scatter chart gives a good general picture of personnel training in EU countries. It describes employees' opportunities to attend training and the amount of training received per employee. The linear trend line shows the interdependency of the participation rate and the amount of training hours.
Participation in personnel training and the amount of training in EU countries in 2010

Romania and the Czech Republic deviate most from the general line. In Romania, the participation rate is the lowest of the EU countries but the amount of training received per employee is relatively high. The Czech Republic makes an exception in the other direction, the participation rate is the highest among EU countries but the amount of training received is slightly below the average for EU countries. Measured by the participation rate, Finland is slightly above the average for EU countries (36%) and measured by the number of hours a bit below the EU average (10 hours).
The results can also be tabulated from Eurostat's database
at:
http://epp.eurostat.ec.europa.eu/portal/page/portal/education/data/database
(>
Education and training > Lifelong learning > Continuing
Vocational Training)
The survey covers enterprises in the private sector with at least ten employees in 2010, excluding agriculture and forestry, education, and health and social work. Finland's response data contains 1,560 enterprises that represent a total of 16,380 enterprises and their 1,150,000 employees. The survey was conducted in the same form in 32 European countries.
The survey is conducted approximately every fifth year and it is used to describe employer-sponsored training, the numbers of participants in course training, and the number of personnel training days received, the content and arrangers of the training, as well as the costs incurred from the training. The survey also examines other training formats apart from course training, enterprises' training strategies and the obstacles for organising training.
Source: CVTS, Continuing vocational training survey, Statistics Finland
Inquiries: Hannu Virtanen 09 1734 2514, Tarja Seppänen 09 1734 3220, cvts@stat.fi
Director in charge: Riitta Harala
Publication in pdf-format (333.3 kB)
- Reviews
- Tables
-
Appendix tables
- Appendix table 1. Participation in course format personnel training in 2005 and 2010 in EU Member States, Norway and Croatia 1) (3.10.2013)
- Appendix table 2. Share of course training costs in labour costs in 2005 and 2010 in EU Member States, Norway and Croatia 1) (3.10.2013)
- Appendix table 3. Course training costs in 2005 and 2010 in EU Member States, Norway and Croatia 1) (3.10.2013)
Updated 3.10.2013
Official Statistics of Finland (OSF):
CVTS, Continuing vocational training [e-publication].
ISSN=1798-0003. Contents and costs of training 2010. Helsinki: Statistics Finland [referred: 12.2.2026].
Access method: http://stat.fi/til/cvts/2010/03/cvts_2010_03_2013-10-03_tie_001_en.html

