Published: 17 March 2010
About one enterprise in two had innovations or activity aimed at innovations in 2006–2008
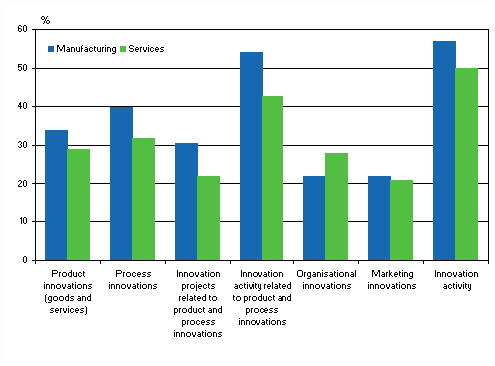
During the 2006–2008 period, just under one-half, or 48 per cent, of enterprises employing at least ten persons engaged in activity connected with product or process innovations. As in the past, innovation activity relating to product and process innovations was more widespread in manufacturing than in services; in manufacturing the share of enterprises with innovation activity was 54 per cent and in services 43 per cent. The data derive from a survey of Statistics Finland concerning innovation activity among enterprises.
The vast majority of enterprises having engaged in innovation activity, or 45 per cent of all enterprises, also reported product or process innovations. Thirty-four per cent of manufacturing enterprises had brought product innovations on the market in 2006–2008 while in services the respective proportion was 29 per cent. The share of enterprises having introduced process innovations was 40 per cent in manufacturing and 32 per cent in services.
Among the manufacturing industries, innovation activity and introduction of innovations were most widespread in the manufacture of chemicals and chemical products (inc. pharmaceutical products and pharmaceutical preparations) and in the manufacture of computer, electronic and optical products. In the examined service industries, innovation activity connected with product and process innovations was commonest in IT services (computer programming, consultancy and related activities) and in telecommunications.
Prevalence of innovation activity in manufacturing and services in 2006–2008, share of enterprises

Besides innovation activity connected with product and process innovations the Innovation Survey examining innovation activity among enterprises also covers marketing and organisational innovations.
A total of one-third of enterprises reported that they had introduced marketing or organisational innovations during the 2006–2008 period. The introduction of such innovations was slightly more common in services where 35 per cent of enterprises had done so, than in manufacturing, at 32 per cent of enterprises. One enterprise in four reported organisational innovations while 22 per cent, or good one-fifth of enterprises reported having made marketing innovations.
If the examination is widened from innovation activity related to product and process innovations to also include marketing and organisational innovations, a total of 54 per cent of enterprises had innovation activity in the period between 2006 and 2008. In manufacturing nearly six out of ten, and in services one-half of enterprises had innovation activity.
The survey covered enterprises employing at least ten persons in manufacturing (incl. mining and quarrying, electricity, gas, steam and air conditioning supply, and water supply, sewerage, waste management and remediation activities) and in certain service industries. The target population of the survey comprises approximately 8,500 enterprises; around 4,200 in manufacturing and 4,300 in the included service industries.
Source: Innovation 2008, Statistics Finland
Inquiries: Mervi Niemi (09) 1734 3263, tiede.teknologia@stat.fi
Director in charge: Leena Storgårds
Publication in pdf-format (259.5 kB)
- Tables
-
Tables in databases
Pick the data you need into tables, view the data as graphs, or download the data for your use.
Appendix tables
- Table 1. Prevalence of innovation activity by size category of personnel, 2006 - 2008, share of enterprises (17.3.2010)
- Table 2. Prevalence of innovation activity by industry, 2006 - 2008, share of enterprises (17.3.2010)
- Table 3. Prevalence of product (good or service) innovations by size category of personnel, 2006 - 2008, share of enterprises (17.3.2010)
- Table 4. Prevalence of process innovations by size category of personnel, 2006 - 2008, share of enterprises (17.3.2010)
- Table 5. Prevalence of marketing and organisational innovations by size category of personnel, 2006 - 2008, share of enterprises (17.3.2010)
- Table 6. Prevalence of marketing and organisational innovations by industry, 2006 - 2008, share of enterprises (17.3.2010)
- Table 7. Prevalence of organisational innovations by size category of personnel, 2006 - 2008, share of enterprises (17.3.2010)
- Table 8. Prevalence of marketing innovations by size category of personnel, 2006 - 2008, share of enterprises (17.3.2010)
Updated 17.3.2010
Official Statistics of Finland (OSF):
Innovation [e-publication].
ISSN=1797-4399. 2008. Helsinki: Statistics Finland [referred: 23.2.2026].
Access method: http://stat.fi/til/inn/2008/inn_2008_2010-03-17_tie_001_en.html

